Software user guide
Console layout
Desktop
Open a browser and go to the address printed on the device label (typically http://io-XXXXX.local):
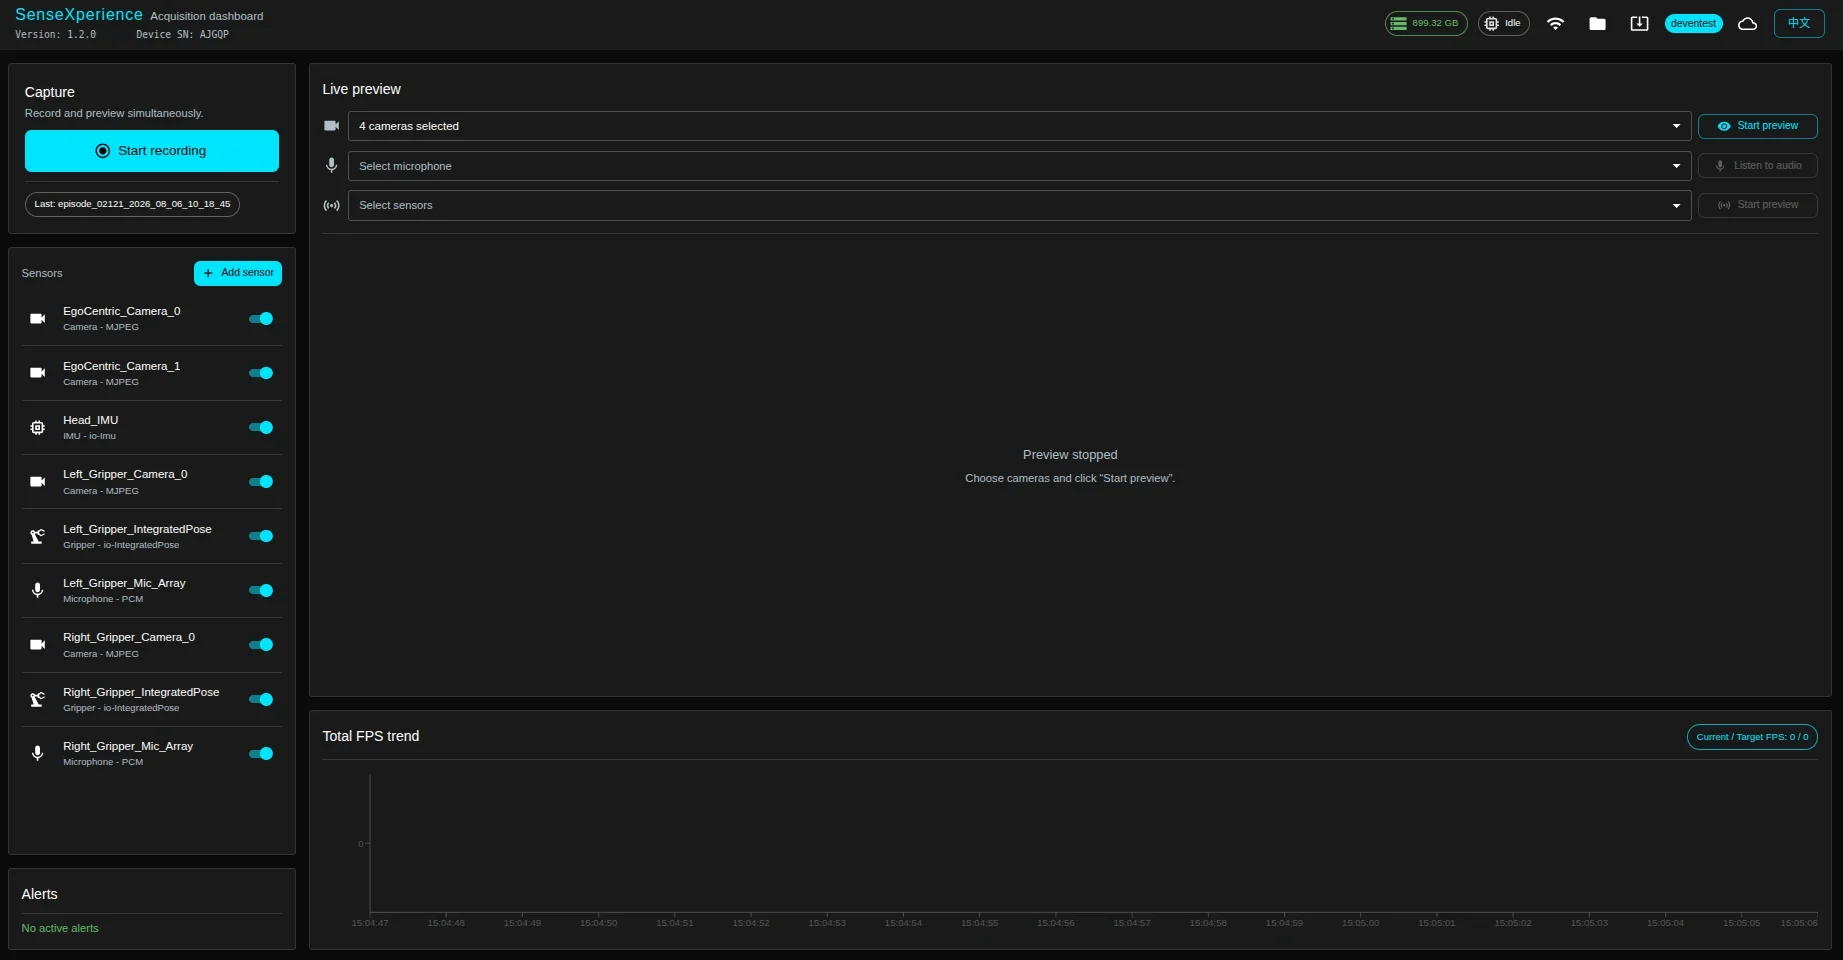
- Top bar (left to right): camera count, free storage, system status, Wi-Fi management, files, upgrade, data platform login, Chinese/English toggle.
- Main panel:
- Left column (top to bottom): record, sensor, alerts.
- Right column (top to bottom): preview (cameras + sensors), total frame rate trends.
Mobile
Open the same URL on your phone. Bottom tabs (left to right):
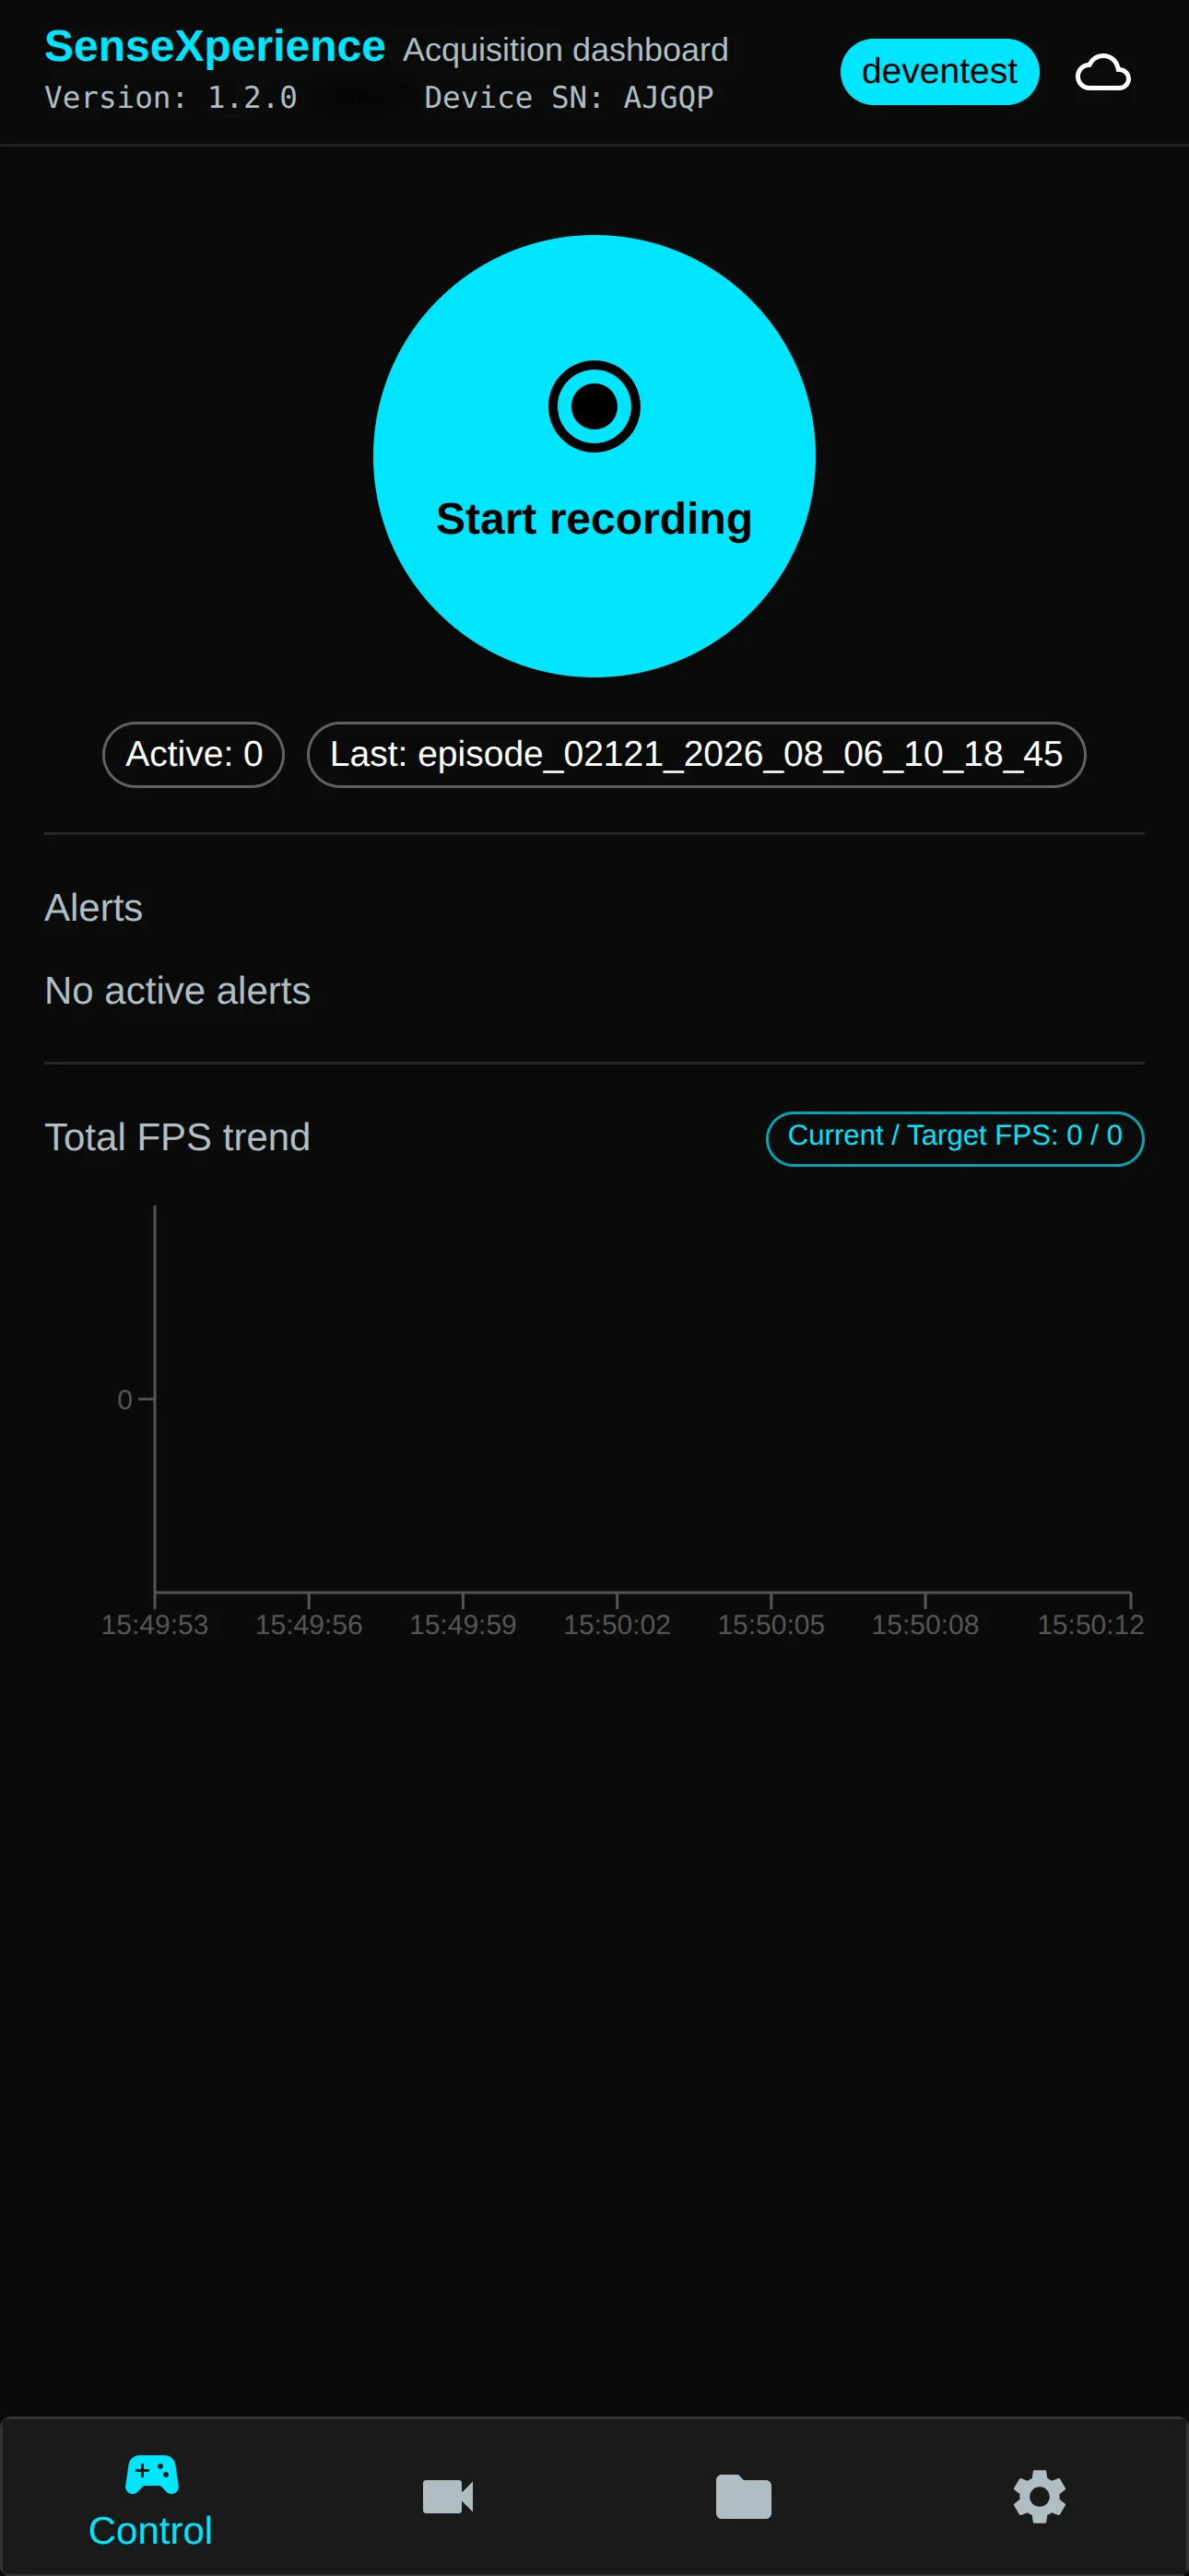 Record | 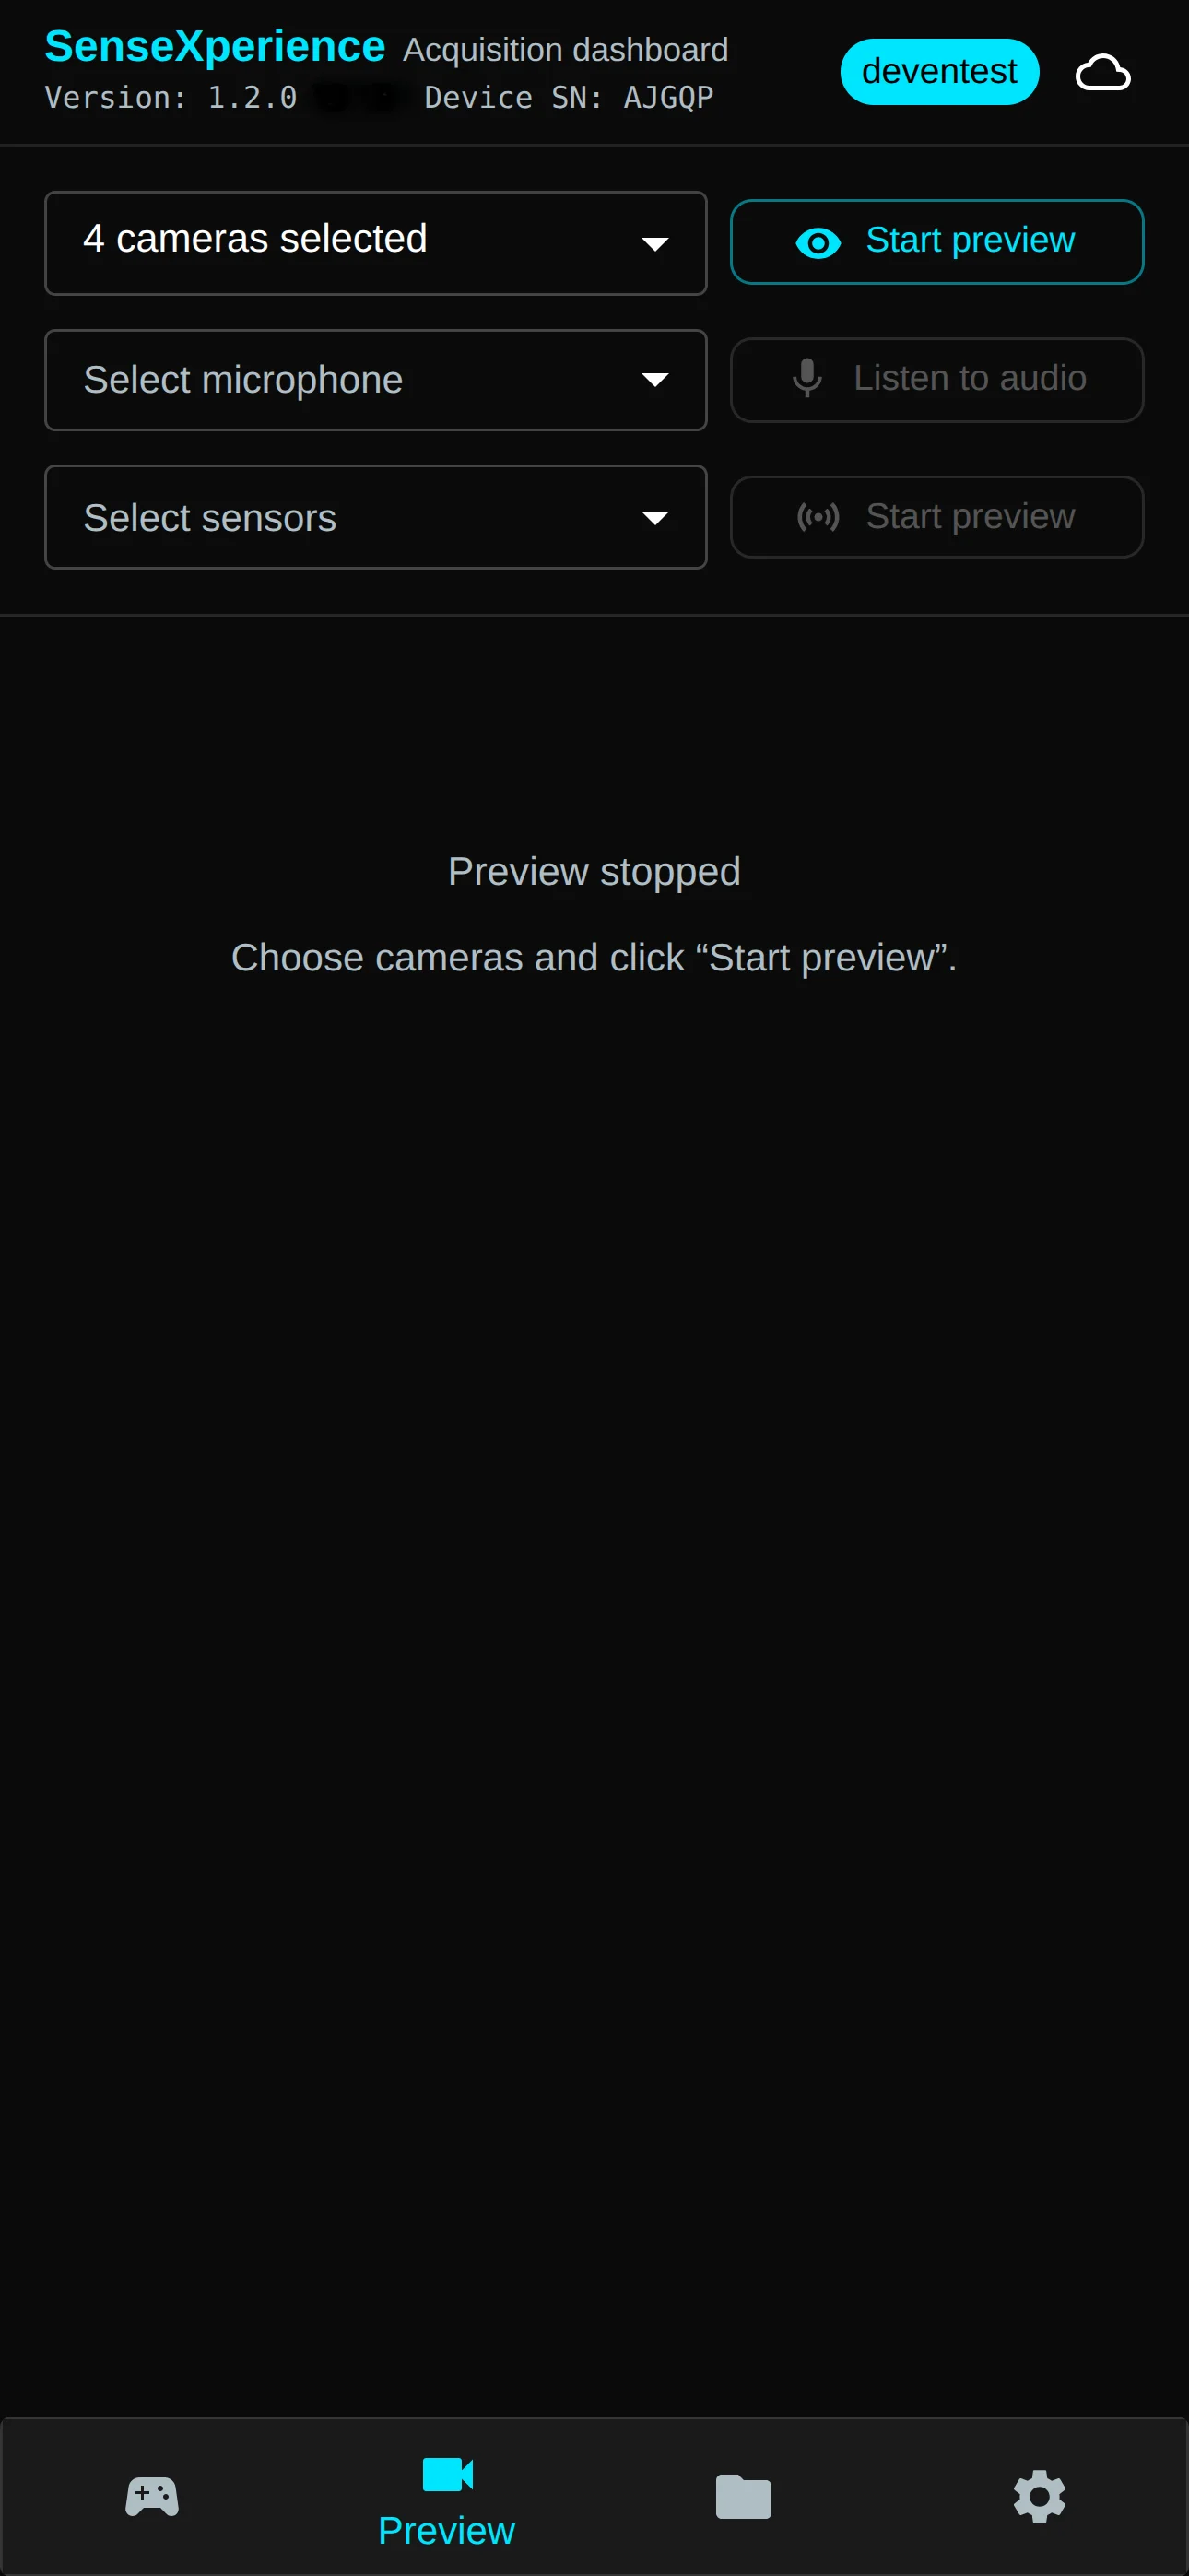 Preview |
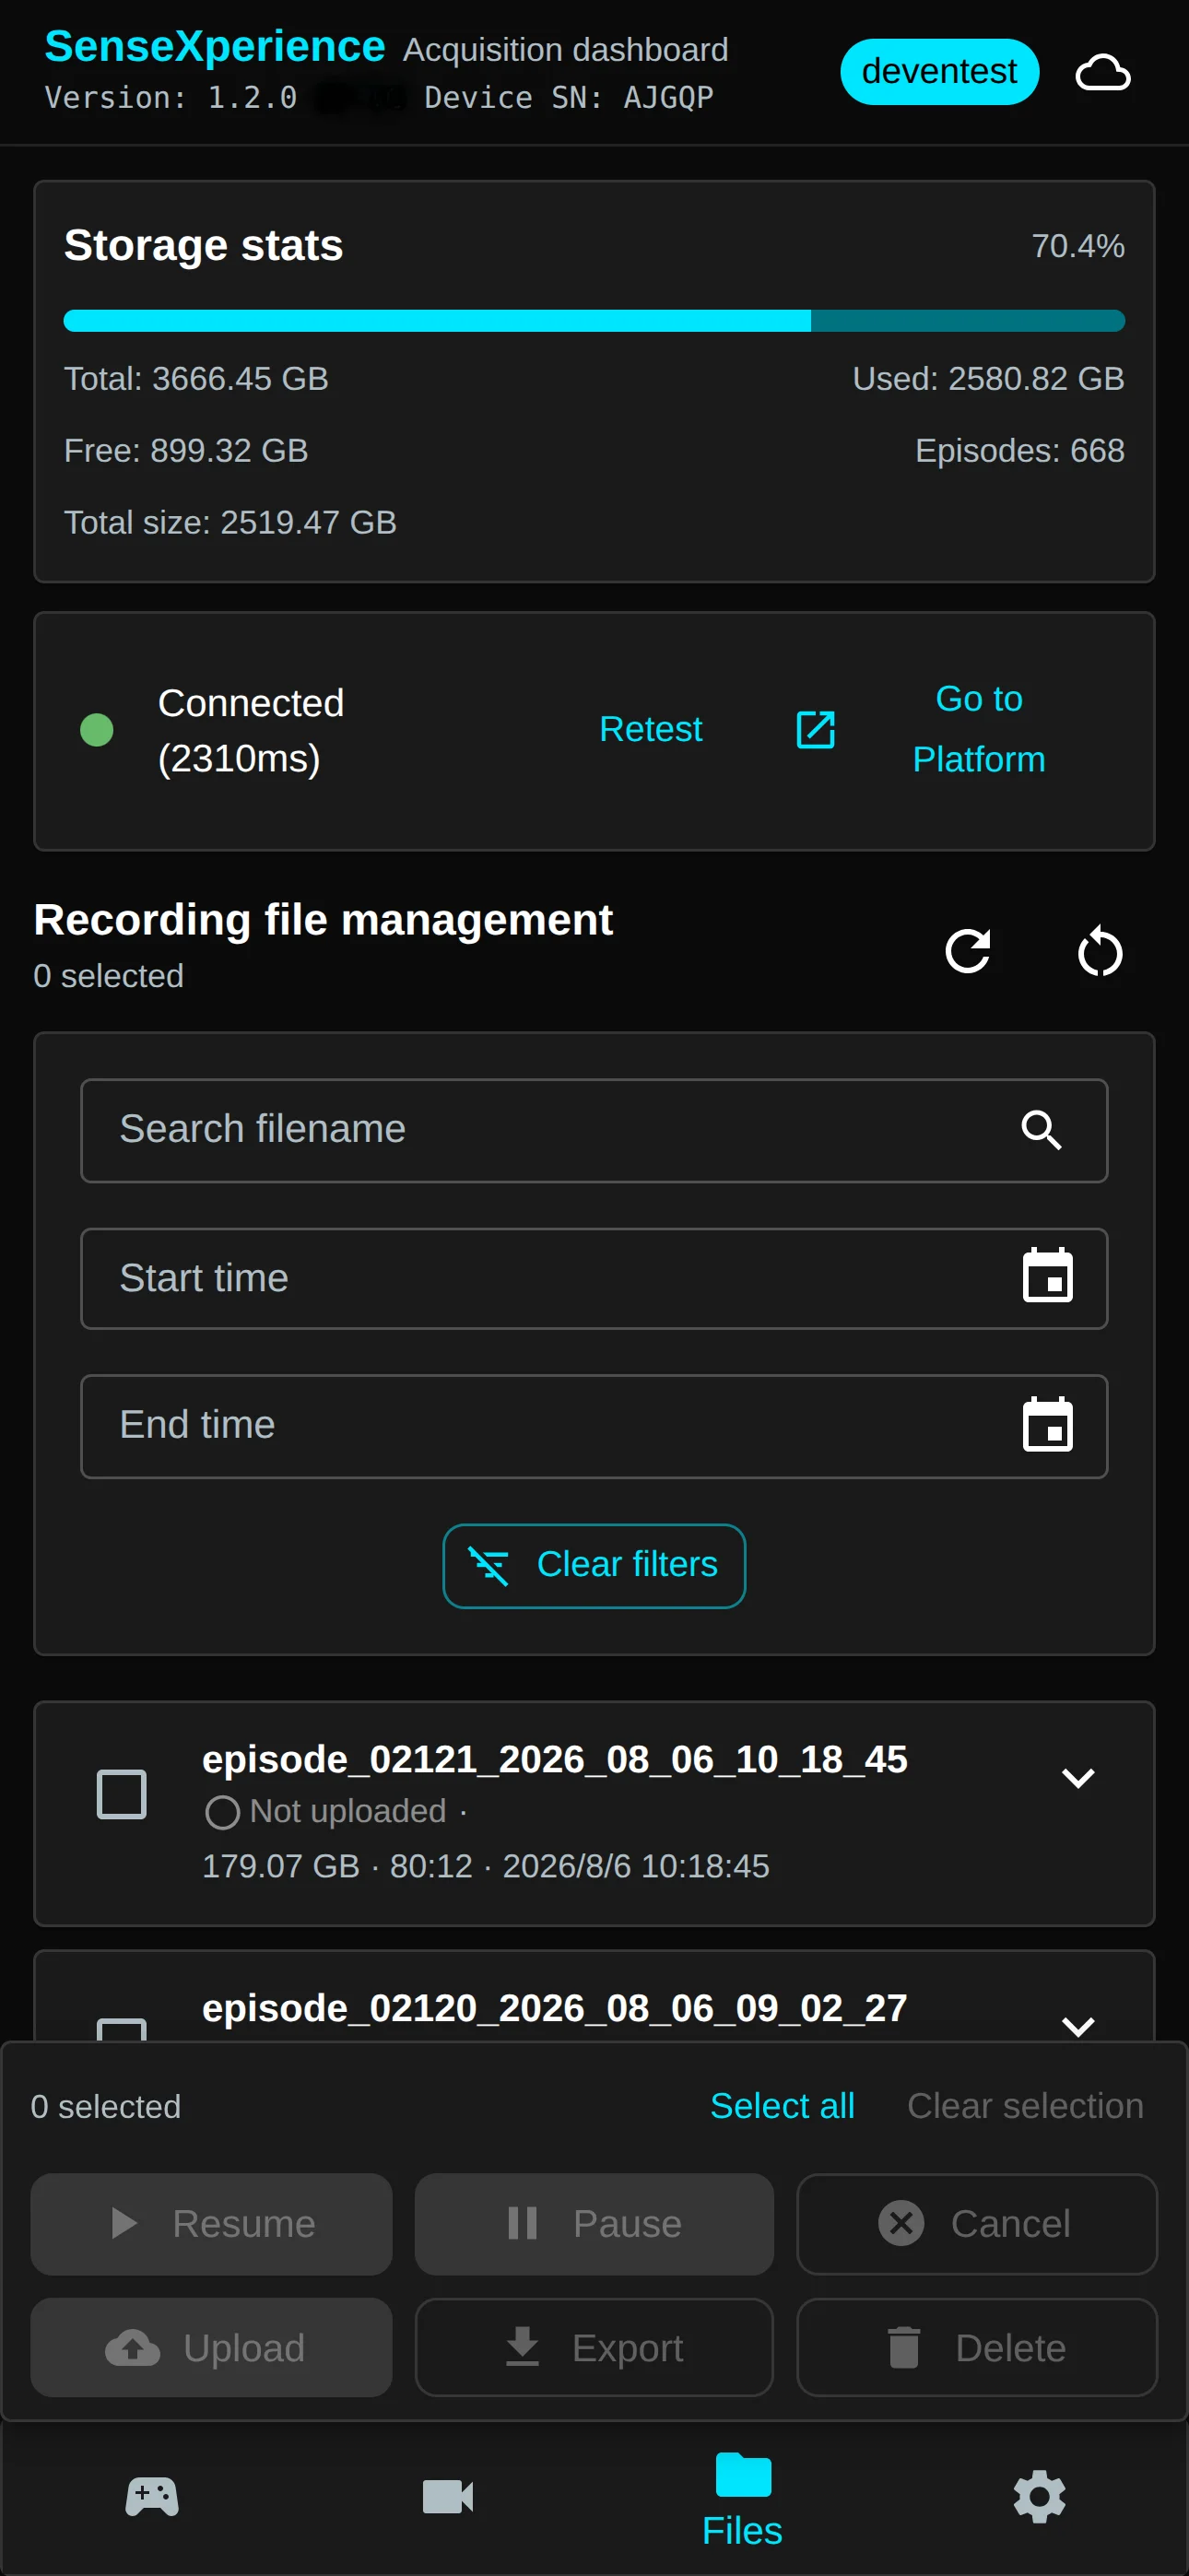 Files | 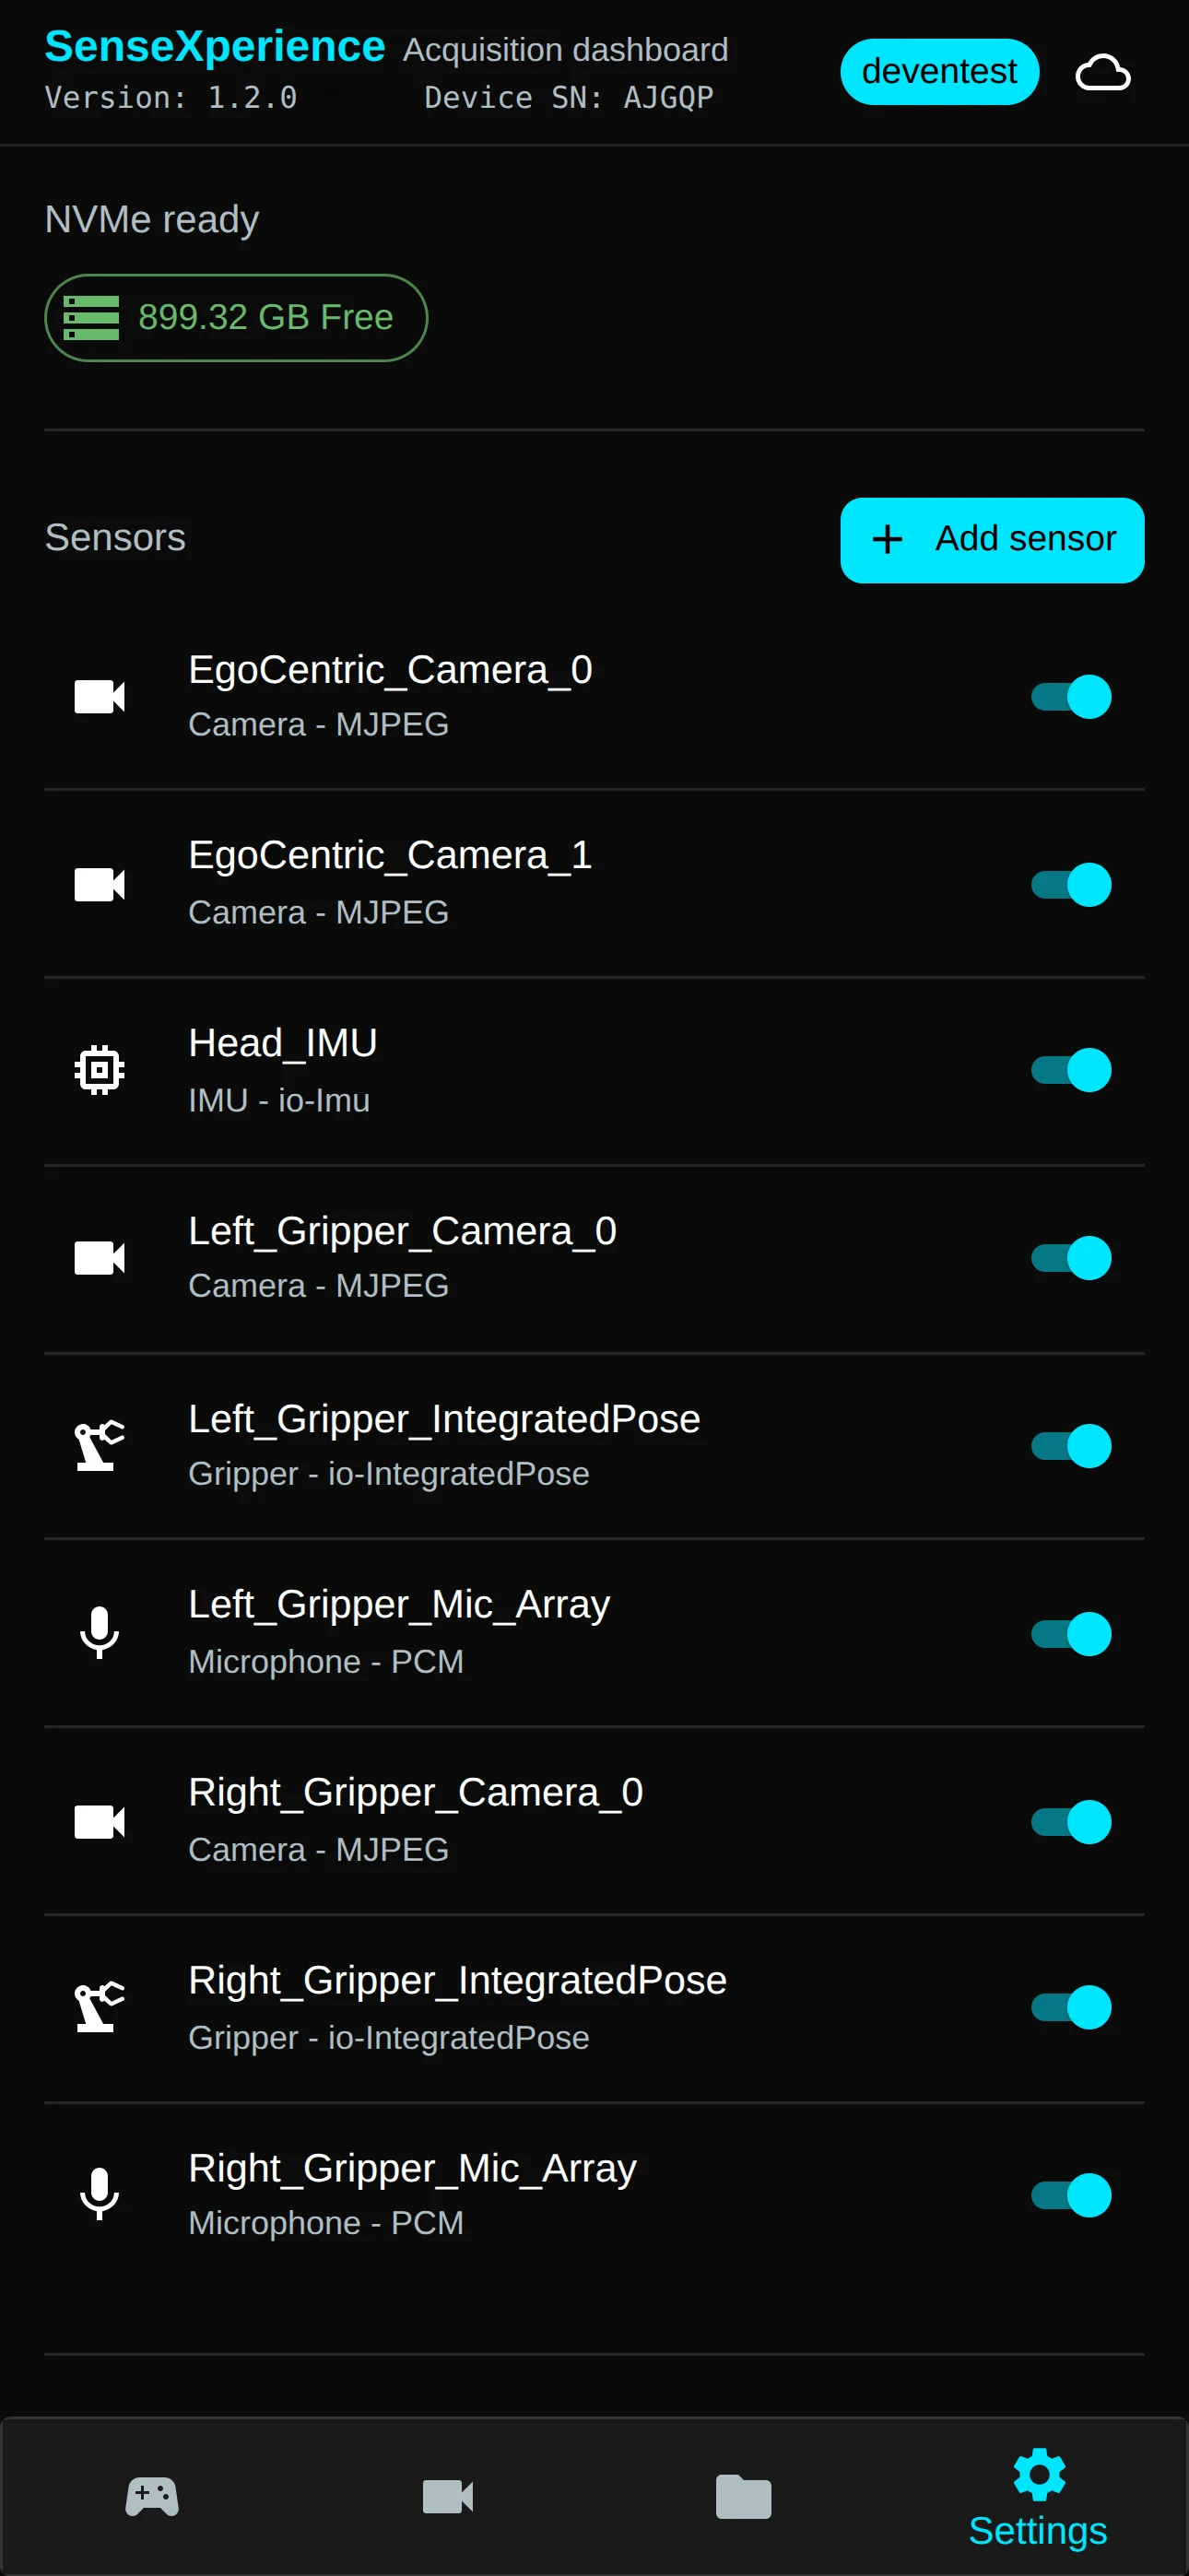 Settings |
- Record: record, alerts, total frame rate trends.
- Preview: preview (camera and sensor data visualization).
- Files: file manager.
- Settings: sensor, Wi-Fi management, Chinese/English toggle, upgrade.
Use the icon at the top-right to sign in to the data platform.
System status
Shows Recording, Preview, or Idle.
Record panel
Start/stop recording and related status.
Alerts
Lists issues such as sensor count mismatch, missing devices, or low disk space.
Sensor panel
Used to configure sensors, enable/disable sensors, and view sensor information.
Total frame rate trends
Shows how total frame rate across sensor streams changes over time.
- Preview only: trends for sensors you have enabled for preview.
- Recording only, or preview + recording: trends for all connected sensors.
- During recording, if frame rate is abnormal (much higher or lower than expected), the chart segment for that period is shown in red.
Preview panel
Controls and tiles for camera and non-camera sensors.
Pre-flight
- Sensors are preconfigured at the factory; with correct wiring the alert panel should be clear.
- Check the sensor panel and confirm every sensor you need is enabled.
Capture
Preview
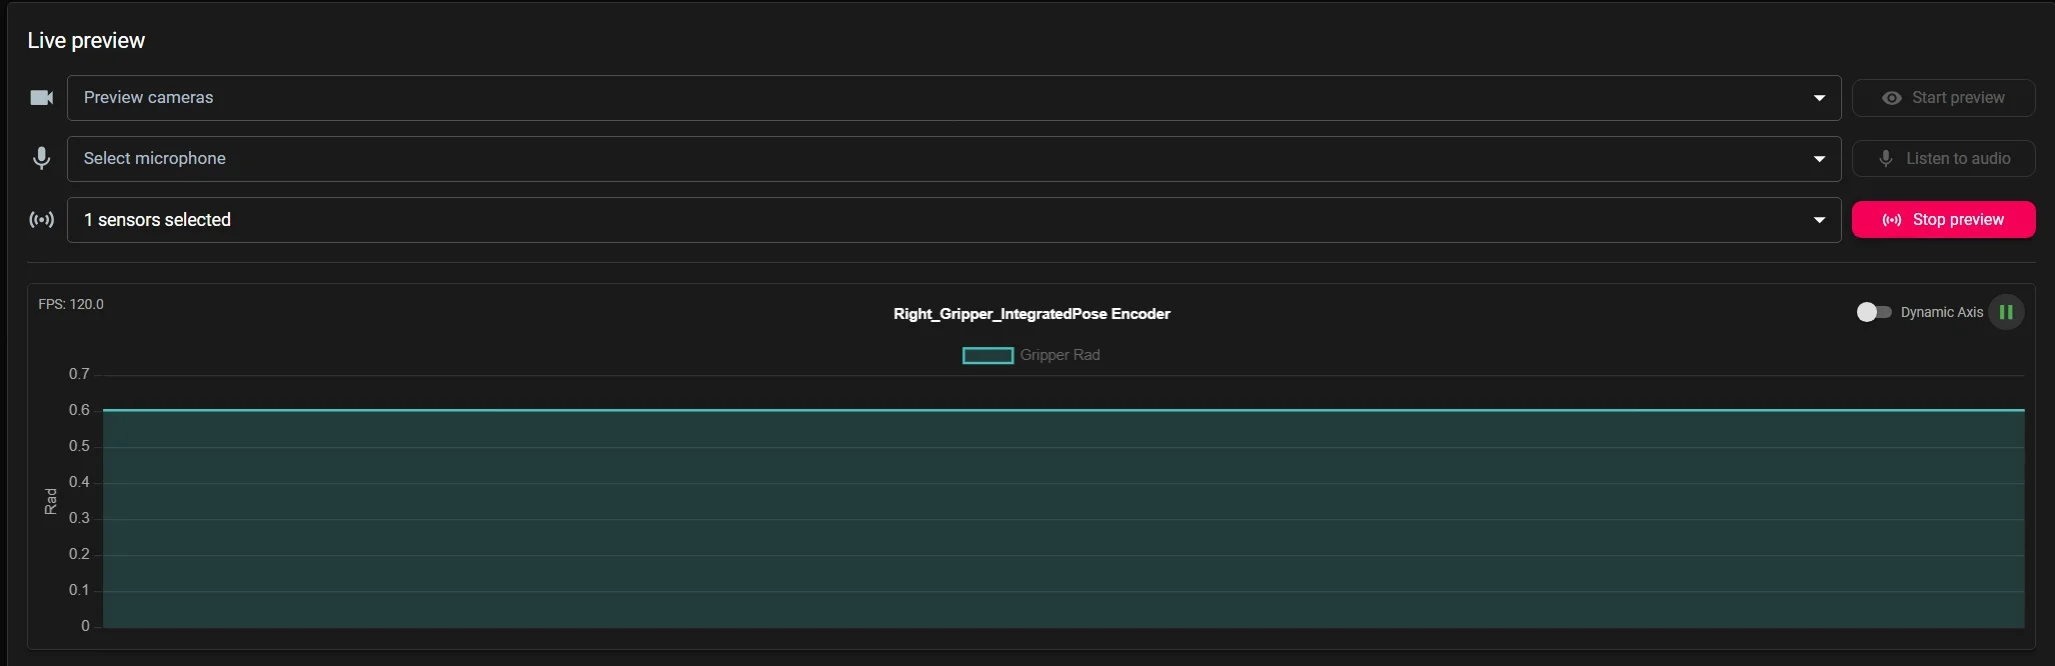
- Select cameras/mics/sensors in the dropdown.
- Click Start preview / Listen next to the dropdown to start the preview for the selected sensors:
- Camera live preview tiles appear in the preview panel.
- Microphone audio plays through the speaker in real time (only one microphone preview at a time).
- Other sensor data is shown as visualisation charts:
- IMU data: shows real-time acceleration and angular velocity trends.
- Encoder data: shows real-time joint-angle trends.
- Click the data name or icon above a chart to show/hide that data stream.
- Click the Pause button in the top-right corner of a chart to freeze the view at the current moment.
- With Dynamic axis on, the vertical axis auto-scales to the data; with it off, the range stays fixed.
- Refreshing the page does not stop preview.
- Toggle sensors in the dropdown while preview runs.
- Click the button again to stop.
Record
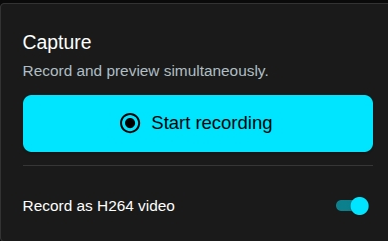
- Choose whether to record H.264 video directly.
- Start recording: 3-second voice countdown, then “start”.
- Refreshing does not stop recording.
- Stop recording ends all selected streams.
When using a gripper, you can open and close it twice in quick succession to start or stop recording (a second trigger is ignored for 3 seconds after the first).
During recording, the gripper indicator LED switches to a flashing green state.
Drop detection
- A steady “deng” prompt indicates drops on a stream; other streams keep recording until you stop.
- No hot-plug recovery mid-take: reconnecting hardware will not resume that stream; voice prompts continue until recording stops.
- Dropped takes show a red detail icon in Files.
Preview + record
- Preview and recording can run at the same time.
- You can start the other function while one is already running.
- While both are active, refreshing the page does not interrupt either.
- Starting or stopping one function does not affect the state of the other.
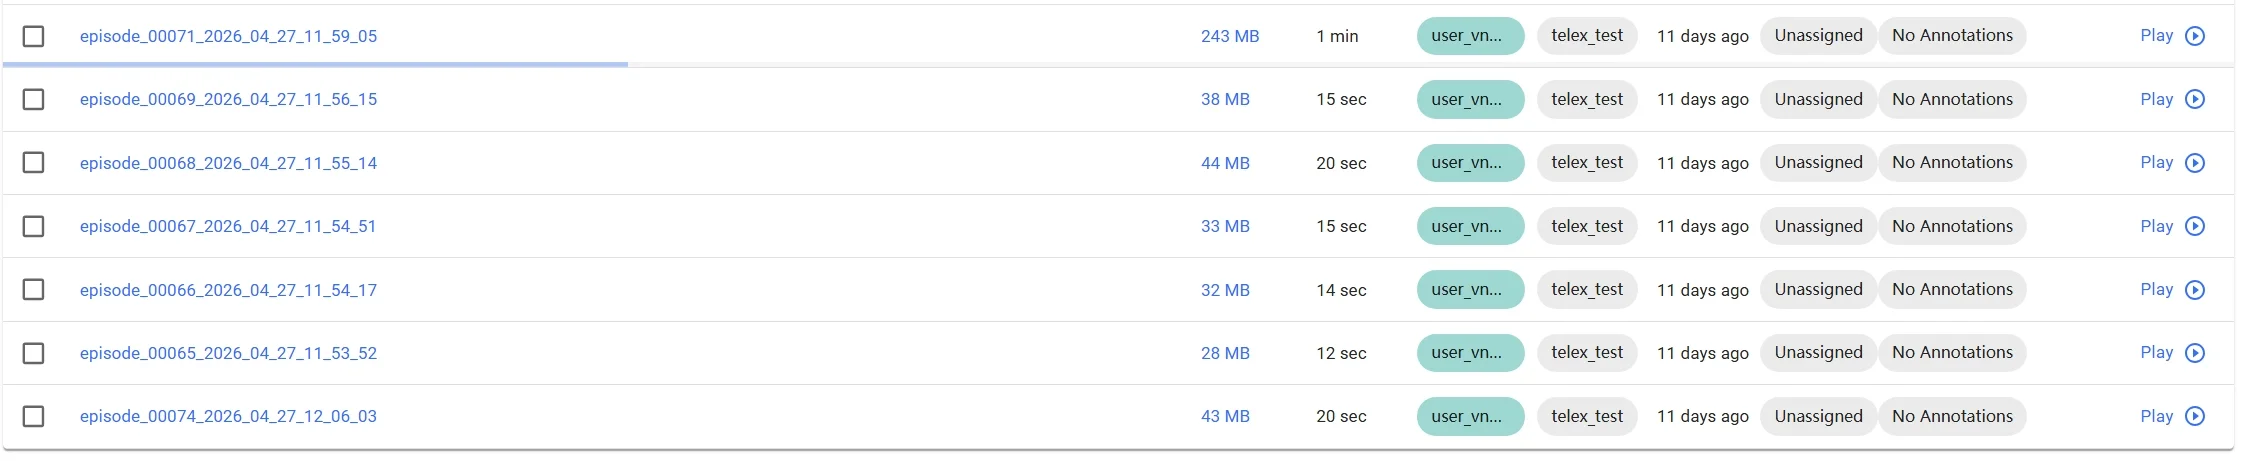
Local files
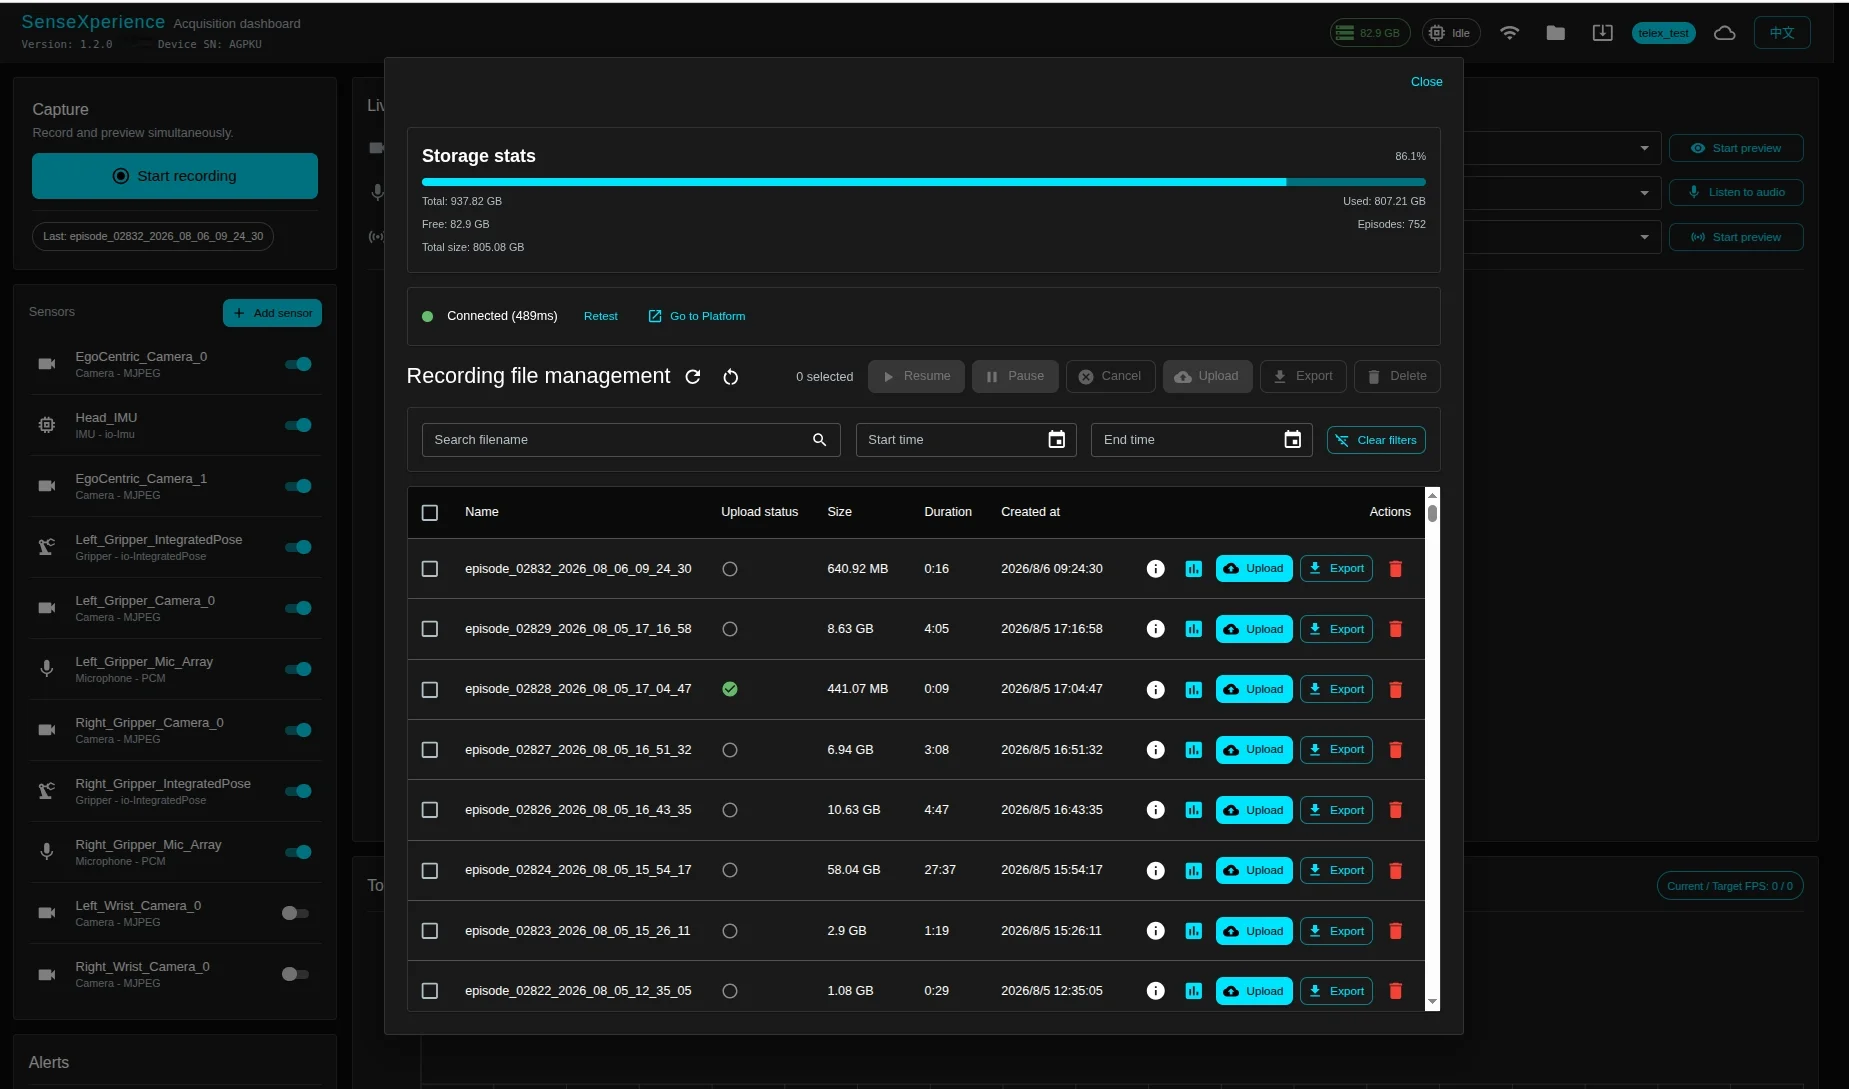
Storage stats
- Shows how much storage is currently in use.
The system reserves space for data processing before export or upload, so it dynamically adjusts the free-space threshold based on the current size of stored files to trigger a low-storage alert in time.
Inspect
Open the detail icon for size, duration, sensor mix, and drop flags (red = drops).
Data playback
Click the playback icon on a data item to enter its playback view.
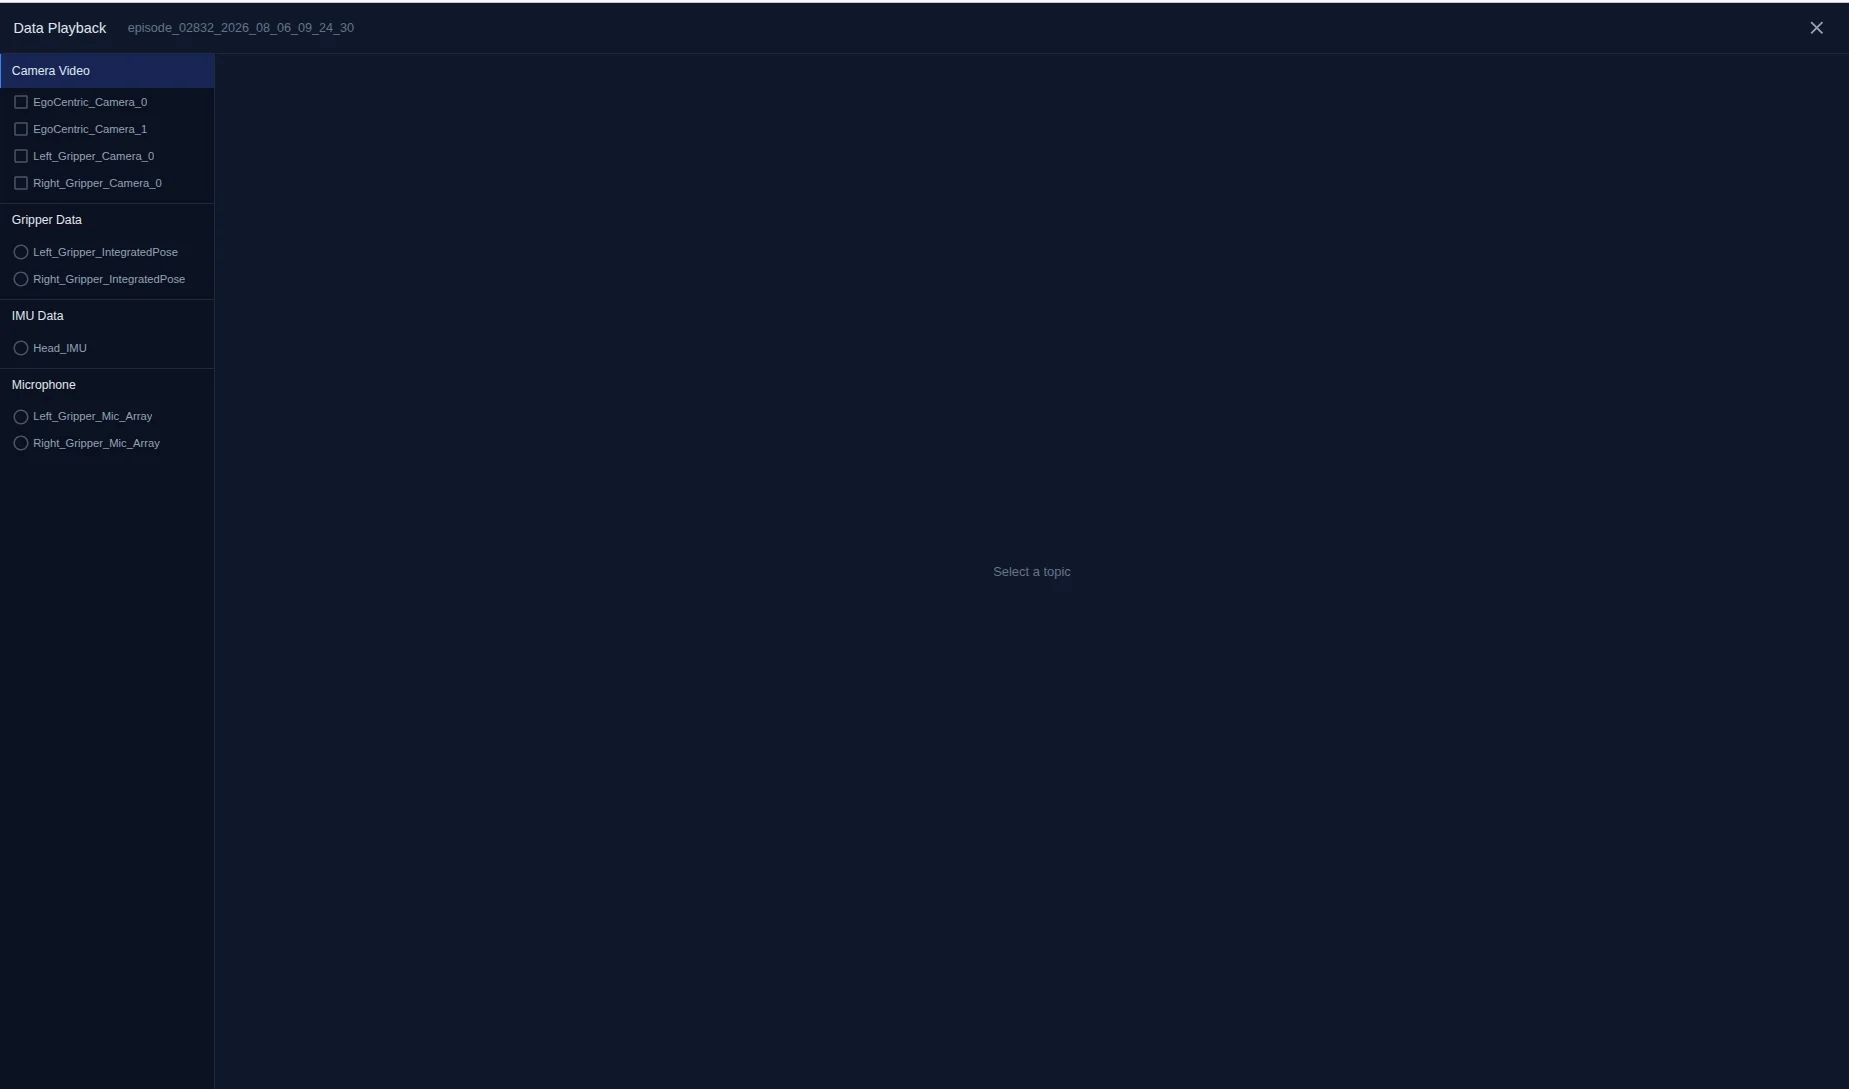
Use the sidebar to select the content you want to view.
Delete
- Single, multi-select, or select-all; click the Delete button to remove the selected files.
- A confirmation dialog appears before deletion. Cannot undo.
Export
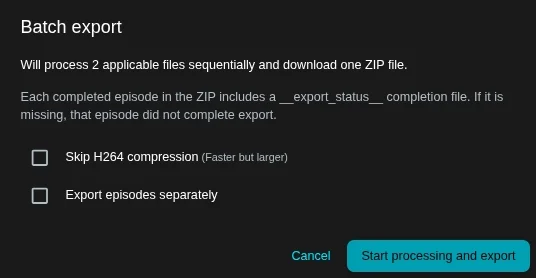
- Single, multi-select, or select-all export.
- Export format is
.mcap; you can choose whether to skip video compression:- Video compression: re-encodes MJPEG to H.264 at about 6% of the original size (lossy / not reversible).
- When exporting multiple files, you can choose whether to merge them into one file.
Upload
Sign in

Sign in once with the credentials shown on the compute unit.
Server status
You can check the current server connection status:
- Connected (green)
- Not connected (red)
Start upload
Per-row upload button or batch select.
Pre-upload conversion
Conversion time scales with file size; you can cancel during conversion.
Progress
Shows percent and progress bar.
Task controls
While uploading, you can:
- Cancel a task
- Pause a task
- Resume a task
States
Task states include:
- Success
- Failed
- In progress
Uploaded data items are marked as uploaded.
Data post-processing
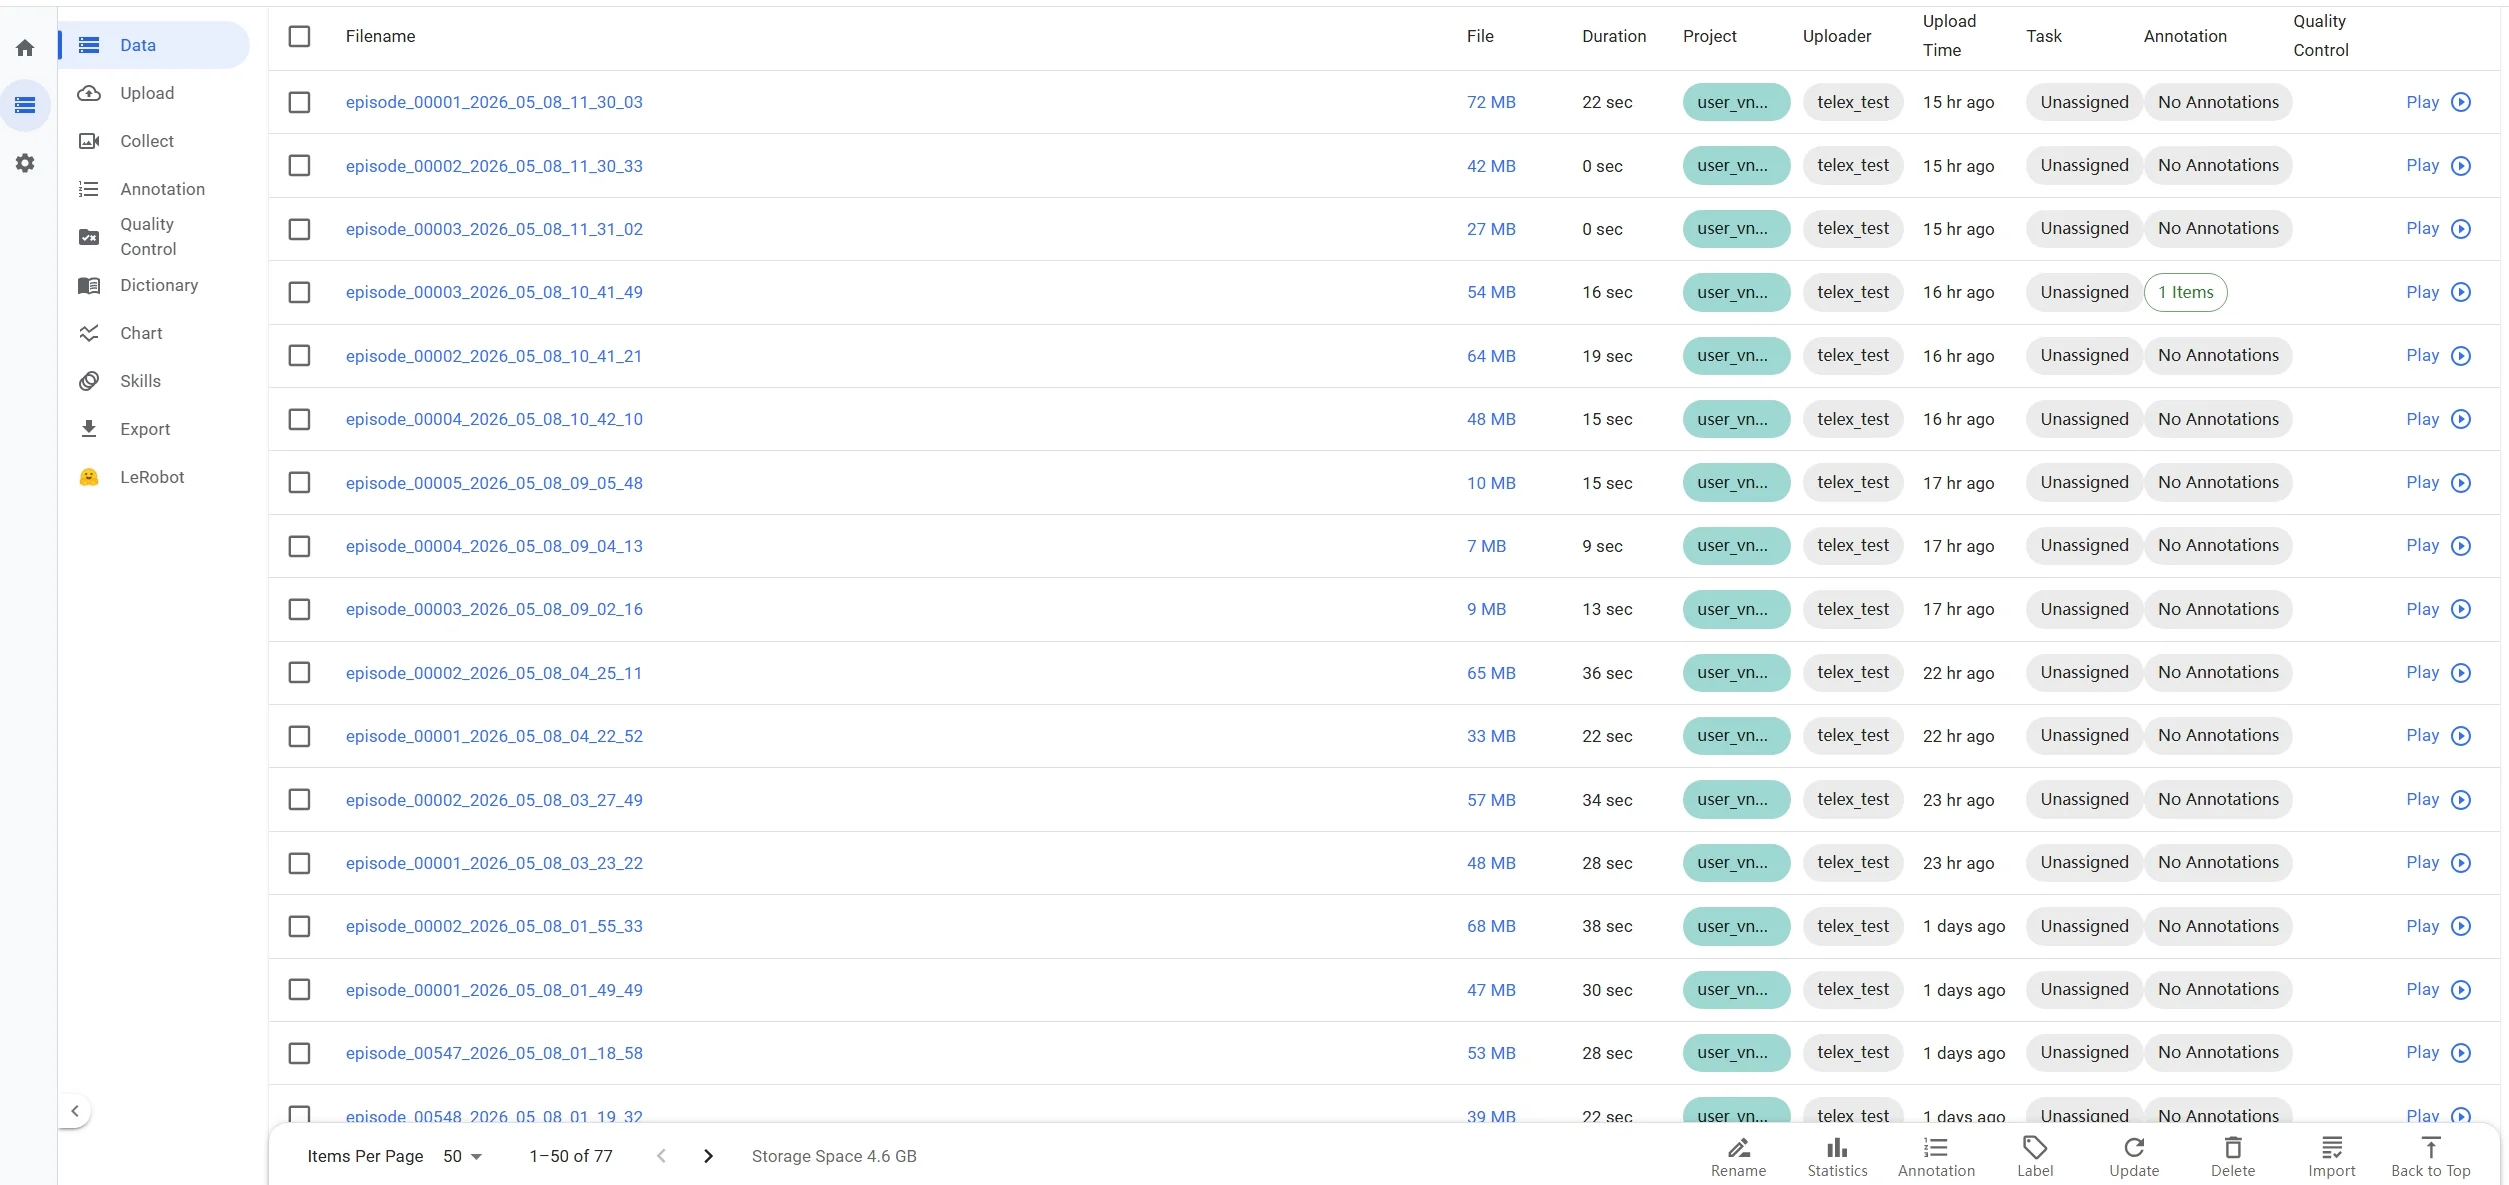
View uploaded data on the data platform
After confirming that the data has uploaded successfully, go to https://sense.io-ai.tech/ (for overseas regions use https://sense.embodiflow.com), sign in to your account, and view the uploaded data on the platform.
Preprocess data
- Select the data you want to preprocess and click Update in the lower-right corner.
- In the dropdown, choose SenseXperience Data Preprocessing (GPU Agent) as the operation type.
- Run in background: turn on this switch to run preprocessing in the background so you can leave this panel while processing continues.
- Click Start processing.
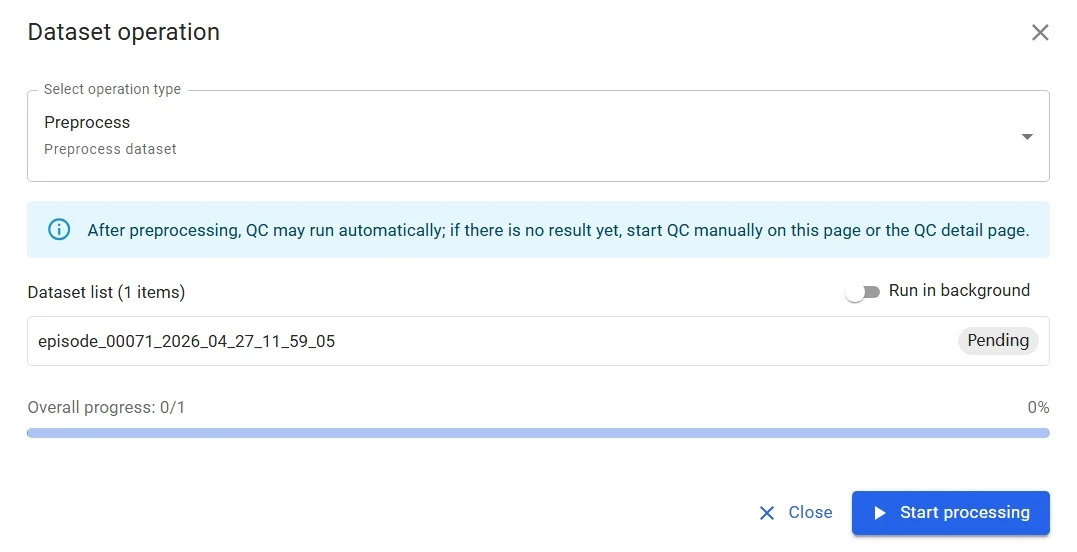
The processing progress bar appears in this panel (when background processing is off) or in the data list (when background processing is on). If the progress bar does not load correctly, contact technical support.
System & configuration
Sensor configuration
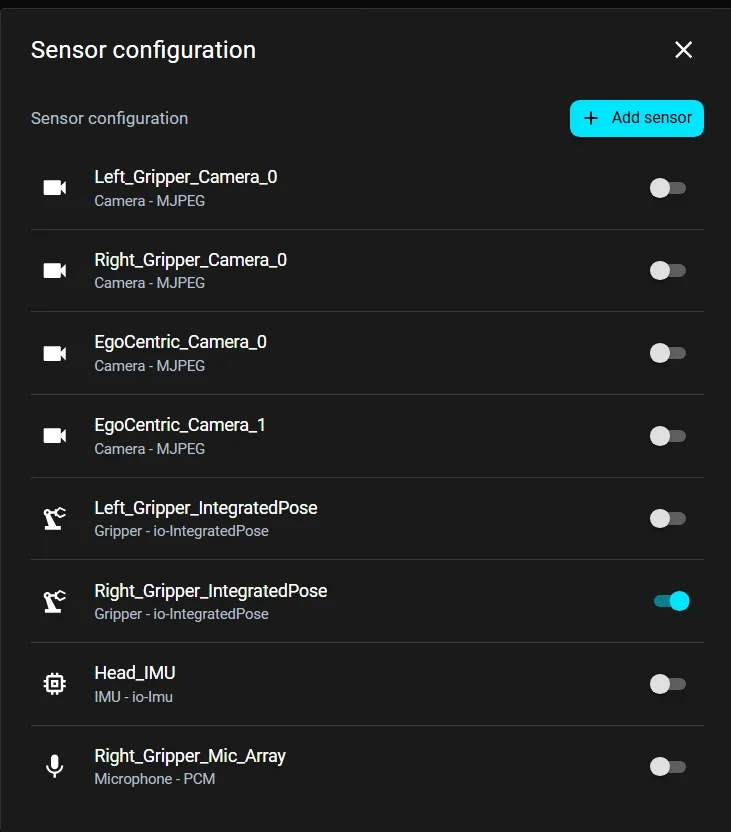
- Factory configuration is usually complete; no manual editing is required.
- You can enable or disable individual sensors.
- To add a new sensor, click Add sensor and fill in the sensor information.
- You can also click a saved sensor configuration profile to edit it.
Wi-Fi management
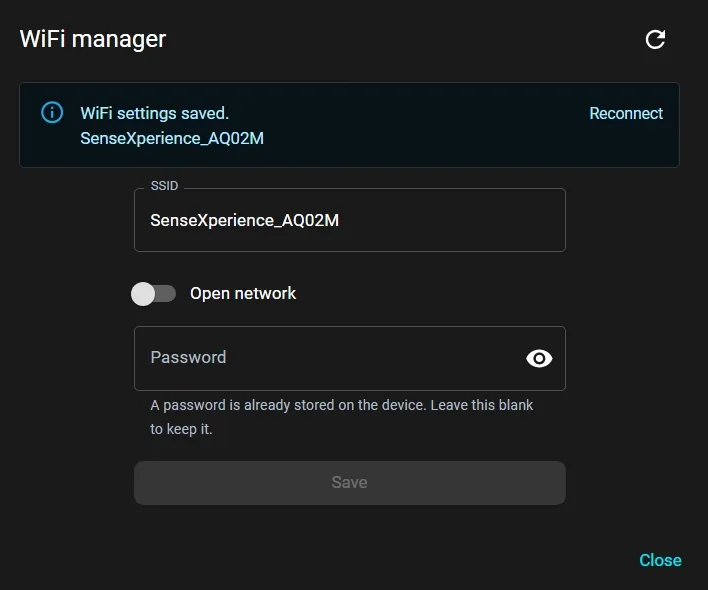
Edit saved Wi-Fi profiles here.
Upgrades
SenseXperience supports both online and local upgrades.
Online upgrade
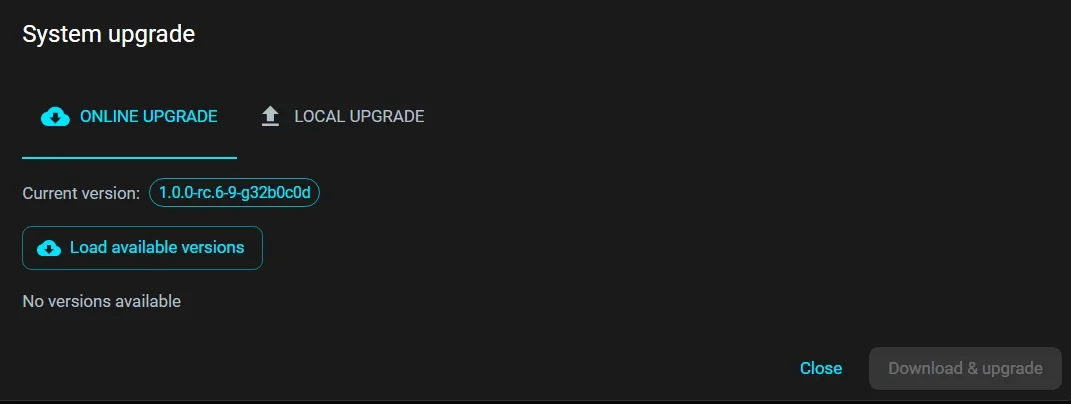
Click Load available versions, pick a build from the list, and apply.
Local upgrade
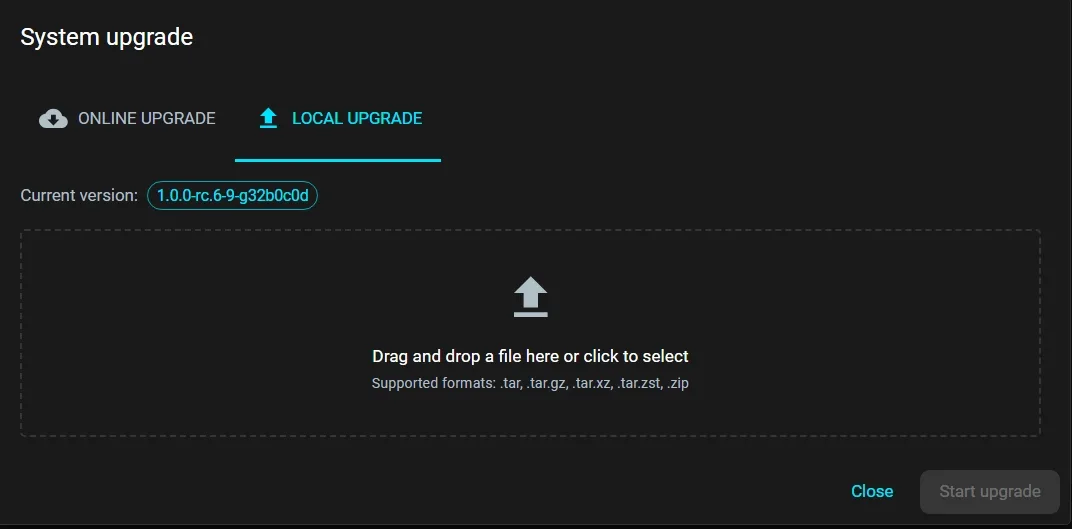
Drag-and-drop a package or browse to select it.
Logs
- Application log storage limit is 100MB; logs are automatically rotated when exceeded.