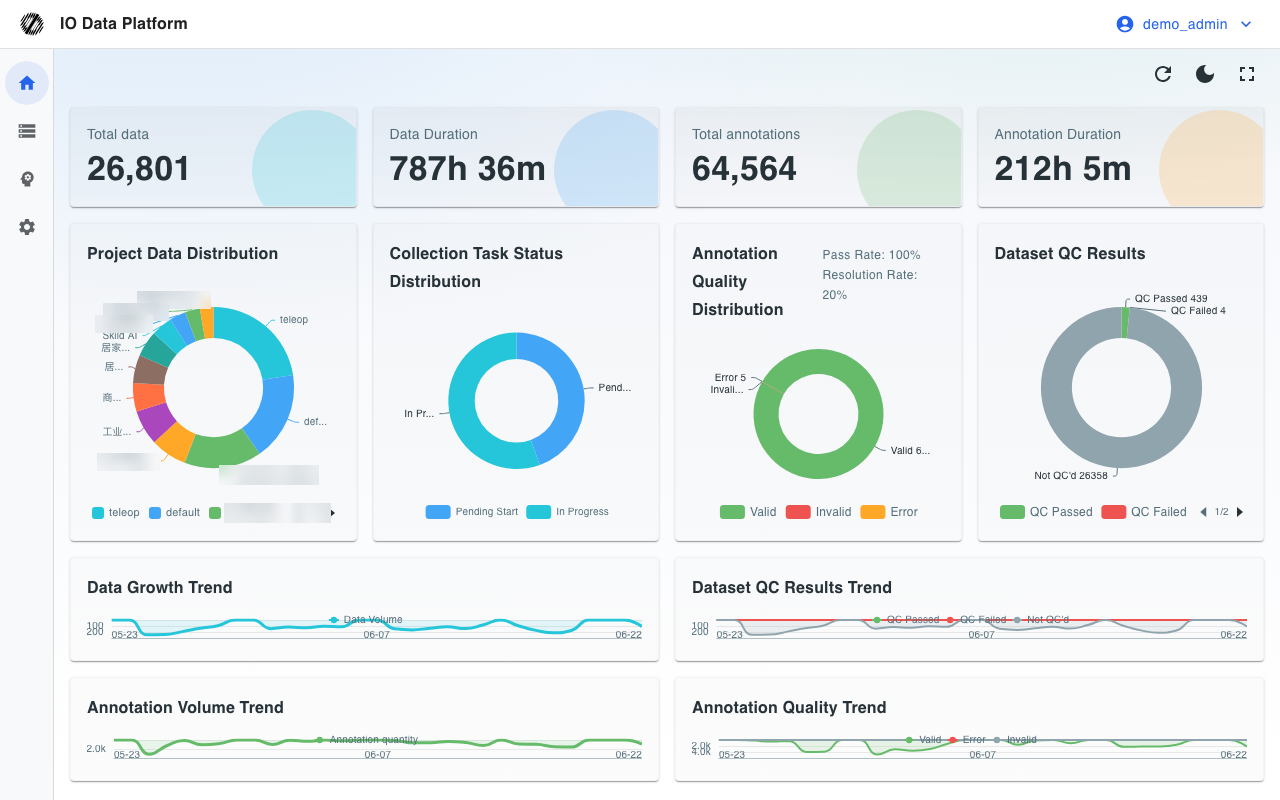
The Overview page summarizes the scale, distribution, quality, and growth trends of the projects visible to the current account. Use it to audit accumulated data volume, annotation quality, and collection task progress. The statistics scope is determined by the account's project permissions, and the page offers no project filter.
Prerequisites
| Item | Description |
|---|
| Menu entry | Overview |
| Route | /dashboard |
| Required permission | “View Overview”; the page is guarded by this permission |
| Related permissions | “Dataset List” (the four metrics and the data charts), “View Projects” (the project list in Project Data Distribution) |
| Visible roles | The Overview menu is visible to all roles |
| Role default | Collector, Annotator, Auditor, and Project Manager are Read Only; Administrator is Read & write |
| Statistics scope | Projects the current account can access; All projects for administrators |
| Effective rules | Administrators are not limited by module permissions; other roles follow the role default template, and user-level overrides take precedence over role defaults |
See Module Permissions for how to configure module permissions.
Metrics and Charts
Top Metrics
Metrics are computed over the projects visible to the current account. They load once when the page opens and reload when “Refresh Data” is clicked.
| Metric | Definition | Display format |
|---|
| Total data | Number of datasets in visible projects | Integer |
| Data Duration | Combined duration of those datasets | {h}h {m}m |
| Total annotations | Number of annotation entries in those datasets | Integer |
| Annotation Duration | Combined duration covered by those annotations | {h}h {m}m |
Metrics depend on “Dataset List”. When permission is missing or there is no data, the value shows “-”.
Distribution Charts
| Chart | Type | Definition |
|---|
| Project Data Distribution | Donut chart | Counts datasets per project and keeps the top 12 projects by count |
| Collection Task Status Distribution | Donut chart | Counts collection tasks by Pending Start, In Progress, Pending Check, Unqualified, Qualified, and Submit Data |
| Annotation Quality Distribution | Donut chart | Counts annotation entries by Valid, Invalid, and Error; the pass rate and resolution rate appear to the right of the title |
| Dataset QC Results | Donut chart | Counts datasets by QC Passed, QC Failed, and Not QC'd |
Pass rate = qualified checks ÷ total checks. Resolution rate = corrected error annotations ÷ total error annotations. Collection Task Status Distribution uses the same visibility scope as Collection Tasks: administrators and project managers count all tasks in the project, while other roles count only tasks they created or that are assigned to them.
Trend Charts
All four trends cover the last 30 days and use daily buckets.
| Chart | Definition |
|---|
| Data Growth Trend | New datasets per day |
| Dataset QC Results Trend | Daily counts of QC Passed, QC Failed, and Not QC'd |
| Annotation Volume Trend | New annotations per day |
| Annotation Quality Trend | Daily counts of Valid, Error, and Invalid annotations |
Page Actions
| Control | Action |
|---|
| Refresh Data | Reloads all metrics and charts |
| Switch to Dark Theme / Switch to Light Theme | Switches the current theme |
| Fullscreen / Exit Fullscreen | Shows the overview on the full screen |
Constraints and Limits
| Item | Value / Condition | Notes |
|---|
| Refresh mode | Manual | Loads once when the page opens; afterwards only the refresh button triggers a reload, with no scheduled auto-refresh |
| Projects in Project Data Distribution | Top 12 projects | Other projects are not shown |
| Trend range | Last 30 days | Daily buckets |
| Empty-state behavior | Charts show “No Data Available”, metrics show “-” | Depends on module permissions and data volume |
| Project filtering | Not available | The statistics scope is determined by the account's project permissions |
Troubleshooting
| Symptom | Possible cause | Action | Owner |
|---|
| Metrics show “-” | The account lacks “Dataset List”, or has no visible projects | An administrator grants “Dataset List” and adds the account to a project | Administrator |
| Charts show “No Data Available” | No data in the range, missing module permission, or a failed API request | Confirm ingested data exists in the range and check module permissions | Administrator |
| Project Data Distribution is missing a target project | The project is outside the account's visible scope, or its dataset count is outside the top 12 | Check the member scope in the Projects module, or filter by project on the Data page | Administrator, Project Manager |
| Collection Task Status Distribution omits tasks owned by other accounts | The current role counts only tasks it created or that are assigned to it | An administrator or project manager checks the visibility scope | Administrator, Project Manager |
| Data is not updated | The page refreshes manually | Click “Refresh Data” | All roles |
Related Pages