Analytics Charts aggregates annotated data by project and presents action relationships, action sequences, action durations, dependencies, and annotation rhythm through five chart types. Chart data comes from the markers annotated within a project, and the project selector switches the statistical scope.
Prerequisites
| Item | Details |
|---|
| Menu entry | Data → Chart |
| Route | /charts, which redirects to /charts/subtree by default |
| Required permission | View Charts |
| API check | The chart data API checks View Projects |
| Visible roles | Administrator, Project Manager, Auditor, Annotator |
| Prerequisite | A project must be selected first; data is not loaded until then |
Chart Contents
Chart Types
The tabs at the top of the page correspond to five chart types.
| Tab | Graphic | What it shows |
|---|
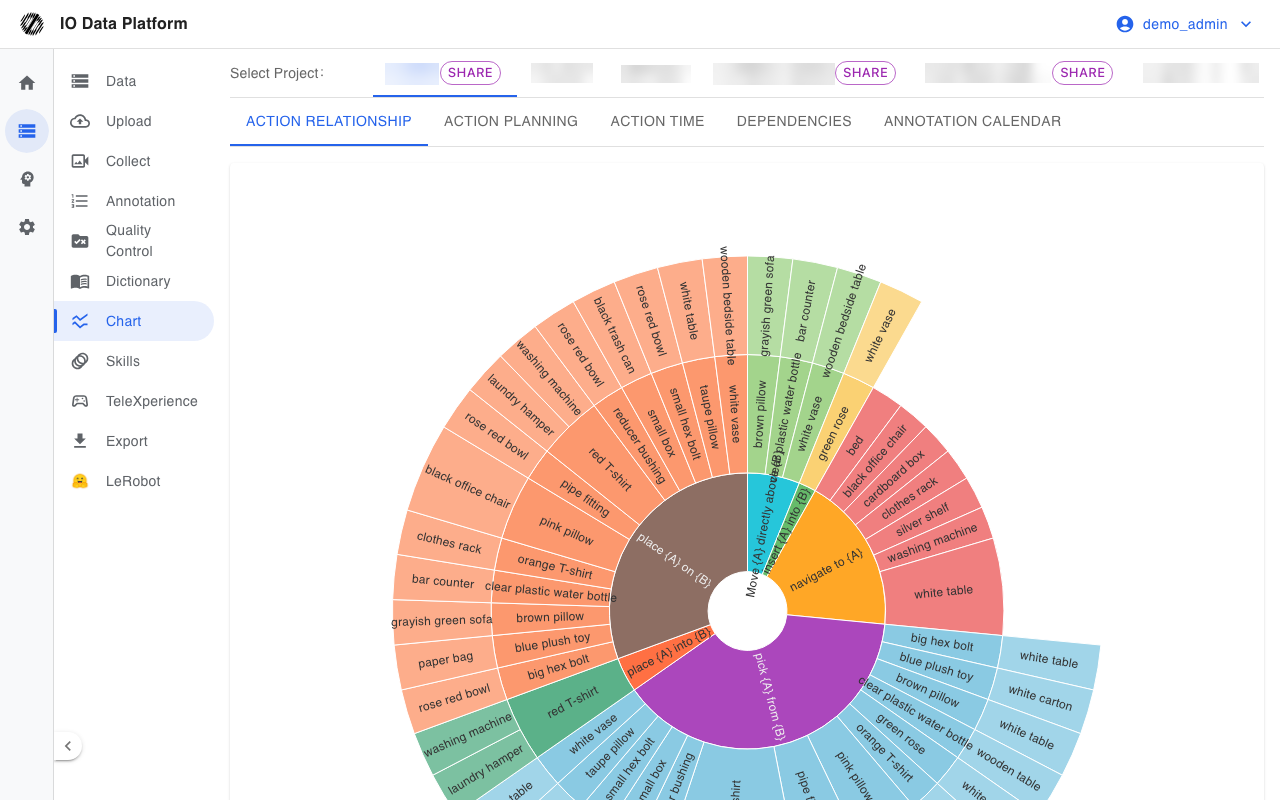
| Action Relationship | Sunburst chart | The hierarchy of skill → object A → object B and the marker count |
| Action Planning | Sankey diagram | The transitions between adjacent actions within one dataset and their occurrence counts |
| Action Time | Stacked bar chart | The average duration of each action, grouped by action, in seconds |
| Dependencies | Circular relationship graph | The source → target dependency between adjacent actions and its occurrence count |
| Annotation Calendar | Calendar heatmap | The daily count of new markers relative to the project average |
Chart Data Rules
| Chart | Data source | Value |
|---|
| Action Relationship | Grouped count of the skill, object A, and object B of markers | The value is the marker count |
| Action Planning | Adjacent actions within one dataset, ordered by start time | The link value is the occurrence count; a looping action is named separately |
| Action Time | Difference between the start and end timestamps of markers | The value is the average duration, in seconds |
| Dependencies | Description text of adjacent actions within one dataset | The link value is the occurrence count |
| Annotation Calendar | Creation date of markers | The value is the marker count added that day |
With the Chinese interface, skill and object names in Action Relationship and Action Planning use the Chinese content of the dictionary; when the dictionary has no entry, the original English content is shown.
Filtering and Empty State
| Item | Value |
|---|
| Project selector | Determines the statistical scope of the charts and is written to the URL query parameter project |
| No data | Show "This project has no data to display yet" |
| Load failure | Show "Failed to load data" |
| Loading | Show a loading indicator |
Constraints and Limits
| Item | Value | Notes |
|---|
| Project prerequisite | Required | No data request is made until a project is selected |
| Data scope | Markers within the project that are not deleted | Data from other projects is not included |
| Action Relationship levels | Three levels: skill, object A, object B | Markers missing a skill or object A are excluded from the statistics |
| Action Planning and Dependencies | Adjacent records within one dataset | A single record produces no link |
| Looping actions | Renamed in Action Planning | An action that points to an earlier step gets a numeric suffix |
| Chart export | Not provided | The page does not offer image or PDF export |
Troubleshooting
| Symptom | Possible cause | Resolution | Owner |
|---|
| The chart area shows "This project has no data to display yet" | The project has no markers, or the fields a chart needs are empty | Confirm the project has annotation data, or switch to a different dataset | Operator |
| The chart area shows "Failed to load data" | The project API request failed or the network dropped | Refresh the page; if it keeps failing, contact an administrator | Operator, Administrator |
| The chart stays in the loading state for a long time | No project is selected | Select a project in the project selector | Operator |
| A skill name appears in English | The dictionary has no matching Chinese content | Add the Chinese content in Dictionary Management | Administrator |
Related Pages