The Operations module consolidates the platform runtime metrics, system information, logs, background tasks, export records, and WebRTC session status for routine inspection and fault isolation. The page and its data APIs require the Administrator role.
Prerequisites
| Item | Content |
|---|
| Menu entry | Manage → Operations |
| Route | /monitor, enters /monitor/overview by default |
| Page permission | "View Ops Monitor" |
| Visible roles | Administrator |
| Data APIs | The monitoring, queue, and log APIs validate the Administrator role |
| Dependencies | Redis (Operations metrics stream and task queues), database |
Subpages
| Subpage | Route | Content shown | Data source |
|---|
| Monitoring Overview | /monitor/overview | Current values and trends of database latency, Redis latency, and queue backlog | Redis Operations metrics stream |
| System Information | /monitor/status | Version, build date and time, Node.js version, Uptime, Hostname, Operating System, Architecture, CPU cores, Total Memory | Server build information and host information |
| System Log | /monitor/logs | Access, active user, login, operation, and workflow logs | Access and audit data |
| Background Tasks | /monitor/jobs | Task list and actions of the system queue and export queue | Task queues |
| Export Records | /monitor/exports | Export task history and artifacts | Export records |
| WebRTC | /monitor/webrtc | Active rooms, publishers, viewers, and track count | WebRTC service room list |
Runtime Metrics
Monitoring Overview
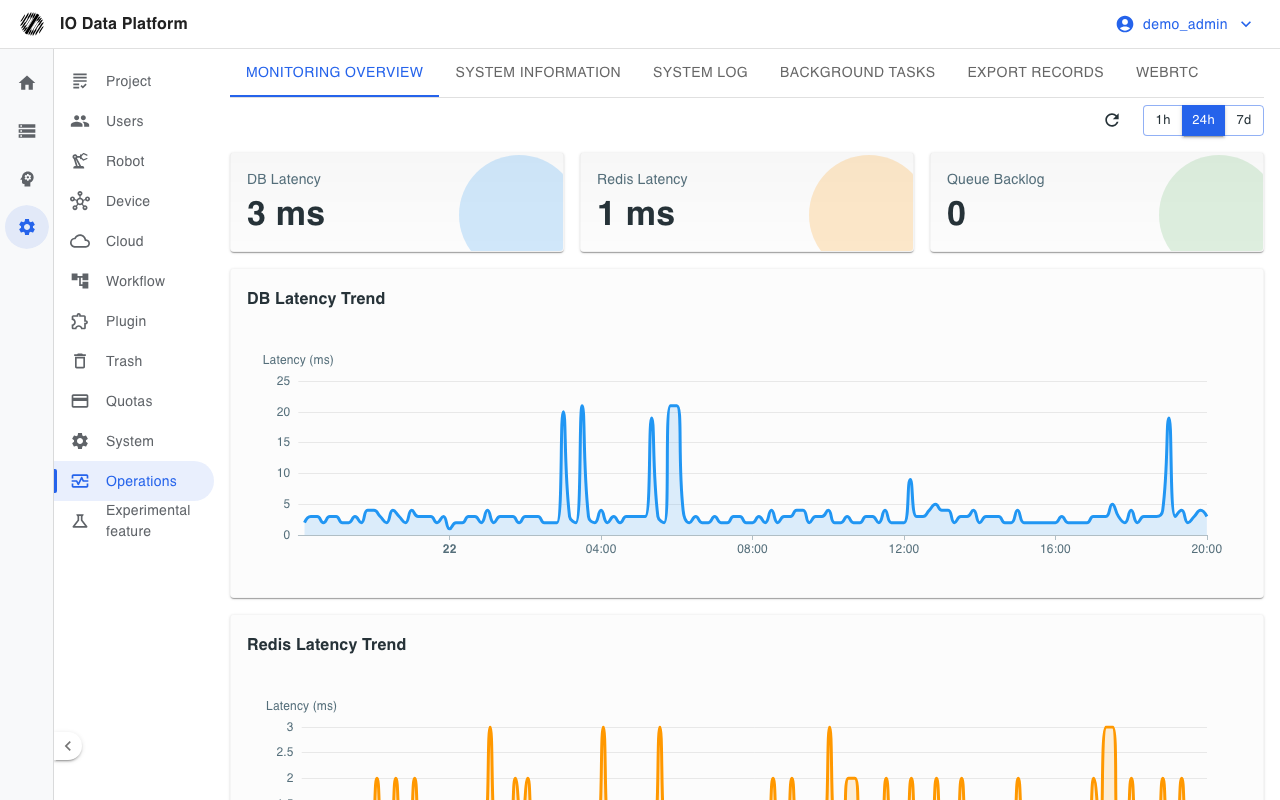
The top of /monitor/overview shows three metric cards, with the corresponding trend charts below.
| Metric | Meaning | Threshold |
|---|
| Database latency | Database probe duration | Below 50 milliseconds is normal, 50–200 milliseconds is a warning, and 200 milliseconds or more is critical |
| Redis latency | Redis PING duration | Below 10 milliseconds is normal, 10–50 milliseconds is a warning, and 50 milliseconds or more is critical |
| Queue backlog | Total number of waiting tasks across queues | Above 100 is a warning, and above 1000 is critical |
| Time range | Purpose |
|---|
| 1 hour | Real-time isolation |
| 24 hours | Routine inspection |
| 7 days | Trend analysis |
The overview summary refreshes automatically every 30 seconds; the "Collect Now" button triggers one manual metric collection and refreshes the summary and trends.
/monitor/status lists application and host information.
| Field | Description |
|---|
| Version, build date, build time | Application build information |
| Node.js version | Runtime version |
| Uptime | Time the process has been running |
| Hostname, Operating System, Architecture | Host information |
| CPU cores, Total Memory | Host resources |
Background Tasks
/monitor/jobs manages the tasks of two queues.
| Queue | Name | Tasks handled |
|---|
| System queue | iojobs | System-level tasks such as data preprocessing |
| Export queue | ioexports | Data export tasks |
| Task status | Description |
|---|
| waiting | Waiting |
| active | Running |
| completed | Completed |
| failed | Failed |
| delayed | Delayed |
| paused | Paused |
| Action | Effect | Constraint |
|---|
| Pause Queue | Pauses processing of the queue | Affects the execution of new tasks |
| Resume Queue | Resumes processing of the queue | None |
| Clear Waiting | Deletes all waiting tasks of the queue | Cannot be undone |
| Clean History | Deletes completed and failed tasks older than 24 hours | None |
| Retry Failed | Retries failed tasks in bulk | Up to 1000 per operation |
| Retry | Re-runs a single failed task | Failed tasks only |
| Stop | Stops a running task | Running tasks only |
| Remove | Deletes a waiting task | Waiting tasks only |
Pausing a queue affects the execution of new tasks, and clearing waiting tasks deletes the waiting tasks.
WebRTC Monitoring
/monitor/webrtc lists the currently active rooms.
| Column | Description |
|---|
| Agent ID | Device Agent ID and publisher IP of the room |
| Status | Online, Disconnect |
| Start time | Session start time |
| Track count | Number of media tracks in the room |
| Viewers | Number of viewers and their IPs |
| Actions | Force disconnect |
Force disconnect requires confirmation and a reconnect-ban duration in hours; a value of 0 means no ban.
Record Queries
System Log
| Subpage | Route | Content | Filter fields |
|---|
| Log overview | /monitor/logs | Today's failed logins, active users, key operations, and data browsing; recent failed logins and locked users | None |
| Access Log | /monitor/logs/visit | Data, account, viewing IP, viewing time | Data, account, IP, time |
| Current active users | /monitor/logs/active | Username, active time, IP address | Time range 1 day, 7 days, 30 days |
| Login Logs | /monitor/logs/login | Username, result, IP address, login type, error message, time | User, username, IP, time range, result |
| Operation Logs | /monitor/logs/operation | Username, operation content, IP address, time | User, IP, time range |
| Workflow logs | /monitor/logs/workflow | Rule ID, time, description | Workflow, dataset, match rule, action rule, time range |
The Log overview provides an immediate unlock entry for locked users. On the Current active users page, an Administrator disables an account. Module permission changes are written to a separate audit record, and the Operations module provides no page to view that record.
Export Records
/monitor/exports requires the "View Export List" permission, and re-exporting requires the "Create Export Job" permission.
| Field | Description |
|---|
| ID, filename, type | Export task identifier and artifact |
| Export parameters, status, user, dataset, creation time, completion time | Task information |
| Status | Queued, Processing, Running, Completed, Failed |
| Type filter | lerobot, hdf5, mcap |
| Actions | Re-export, which requeues the task; completed records allow downloading the artifact |
Troubleshooting
| Symptom | Possible cause | Action | Owner |
|---|
| No data in the overview | Metrics not yet collected, or Redis is unavailable | Click "Collect Now"; check the Redis connection | Operations |
| Database or Redis metric marked critical | The corresponding service responds slowly, the connection pool is exhausted, or the network jitters | Check the load and connections of the corresponding service | Operations |
| Queue backlog keeps growing | Task volume exceeds capacity, the Worker is not running, or a single task takes too long | Check the Worker status and, if necessary, pause the queue and clear waiting tasks | Operations |
| A task stays running for a long time | Worker failure, or the task is blocked | Stop the task and retry | Operations |
| No data on a log page | No records in the time range, or the filter is too narrow | Widen the time range or clear the filter | Administrator |
| WebRTC room cannot be force-disconnected | The request failed | Retry the operation and check the WebRTC service status | Operations |
Related Pages